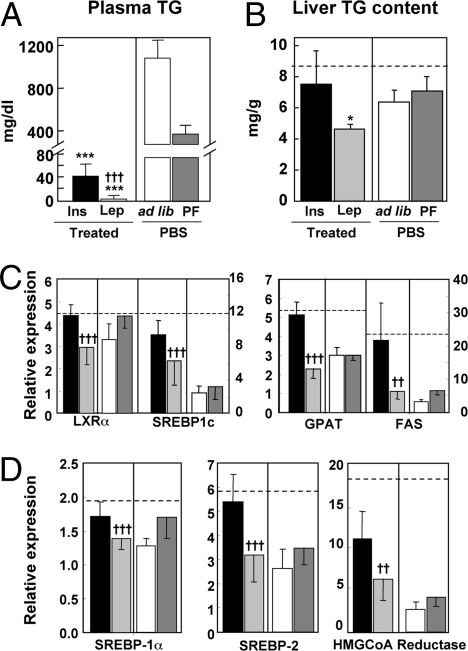
Fig. 2.
TG concentrations in plasma and liver and expression levels of transcription factors and enzymes involved in lipogenesis and cholesterologenesis in livers of type 1 diabetic NOD mice treated either with s.c.-infused leptin ( ) or insulin delivered from an s.c. pellet (■). Untreated controls infused with PBS were either fed ad libitum (□) or pair-fed (PF) to the leptin-treated group (
 ). (A) Plasma TG concentration. (B) Liver TG content. (C) Hepatic expression of a lipogenic transcription factor, LXRα and SREBP-1c, and lipogenic enzymes, FAS and GPAT. (D) Hepatic expression of transcription factors, SREBP-1a and -2, and enzyme, HMG CoA reductase, involved in cholesterologenesis. Relative expression signifies the ratio of the mRNA of interest to the mRNA of 36B4, the invariant control. The broken horizontal lines indicate the relative expression level of the mRNA in nondiabetic control mice. [*P ≤ 0.05; **P ≤ 0.01; ***P ≤ 0.001 vs. ad libitum–fed untreated (PBF) controls; †P ≤ 0.05; ††P ≤ 0.01; †††P ≤ 0.001 leptin treatment vs. insulin.]

