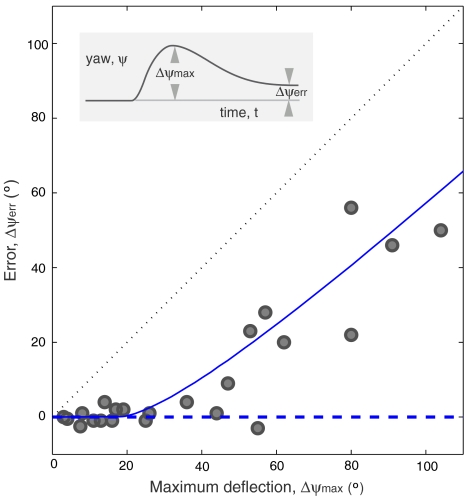
Fig. 2.
Accuracy of the corrective response. (Inset) For each trial, the error Δψerr (final minus initial yaw) and maximum induced deflection Δψmax are measured from the yaw dynamics. In the main figure, the error is plotted against the deflection for 23 experiments. The dashed blue horizontal line is the predicted perfect correction from a linear control model, and the solid blue line is the result of a nonlinear model. See text for details of both models.

