
Figure 8.
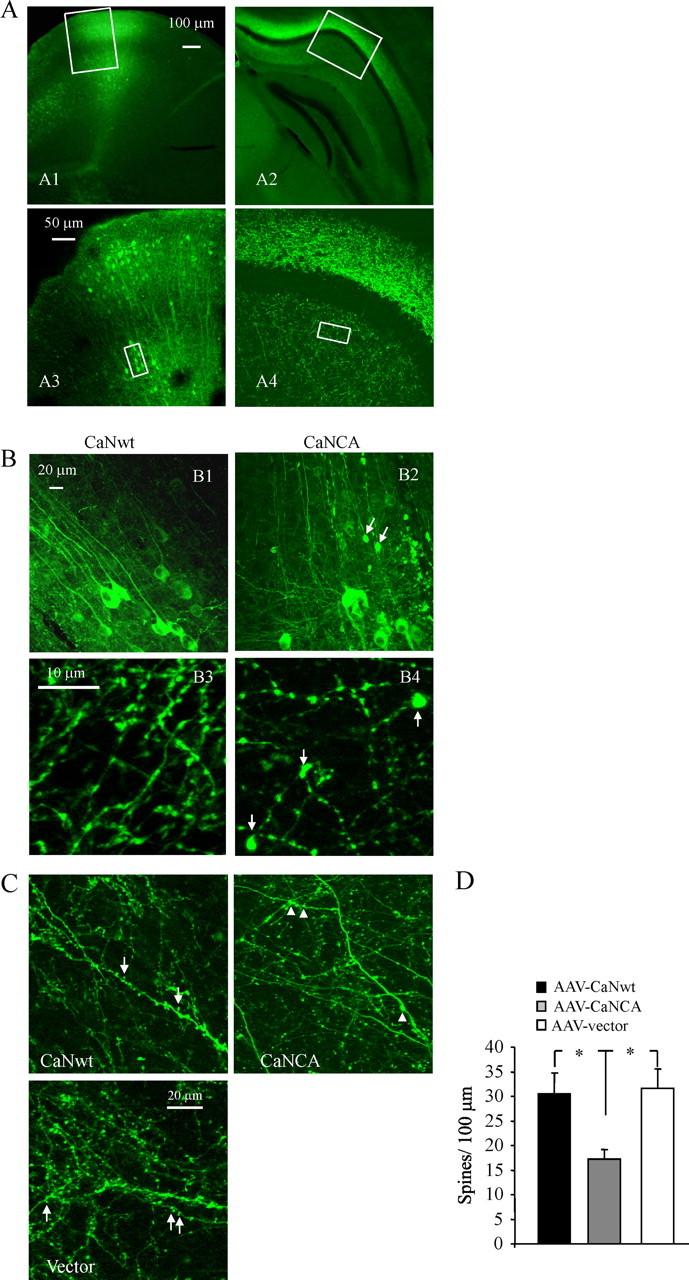
Overexpression of CaNCA, but not CaNwt, in the intact mouse brain induces abnormal morphologies. A, Representative images in different magnifications from cortex (A1, A3) and hippocampal areas (A2, A4) after CaNCA or CaNwt transduction showing GFP expression in fixed postmortem brain sections stained with GFP antibody. B, Representative high-power images of neuronal processes corresponding to areas indicated in A from CaNwt (B1, B3) or CaNCA (B2, B4) injected mice. Arrows indicated neurites or axons with typical dystrophies. C, D, Images of dendritic spine (C) and quantitative analysis of spine densities (D) from live imaging of neurons without apparent dystrophies shows a decrease in spine density with CaNCA overexpression. In C, arrows indicated spines, and arrowhead indicated neurites with typical dystrophies. *p < 0.05; values represent mean ± SD (n = 4 animals for each condition and total >400 spines).