
Figure 3.
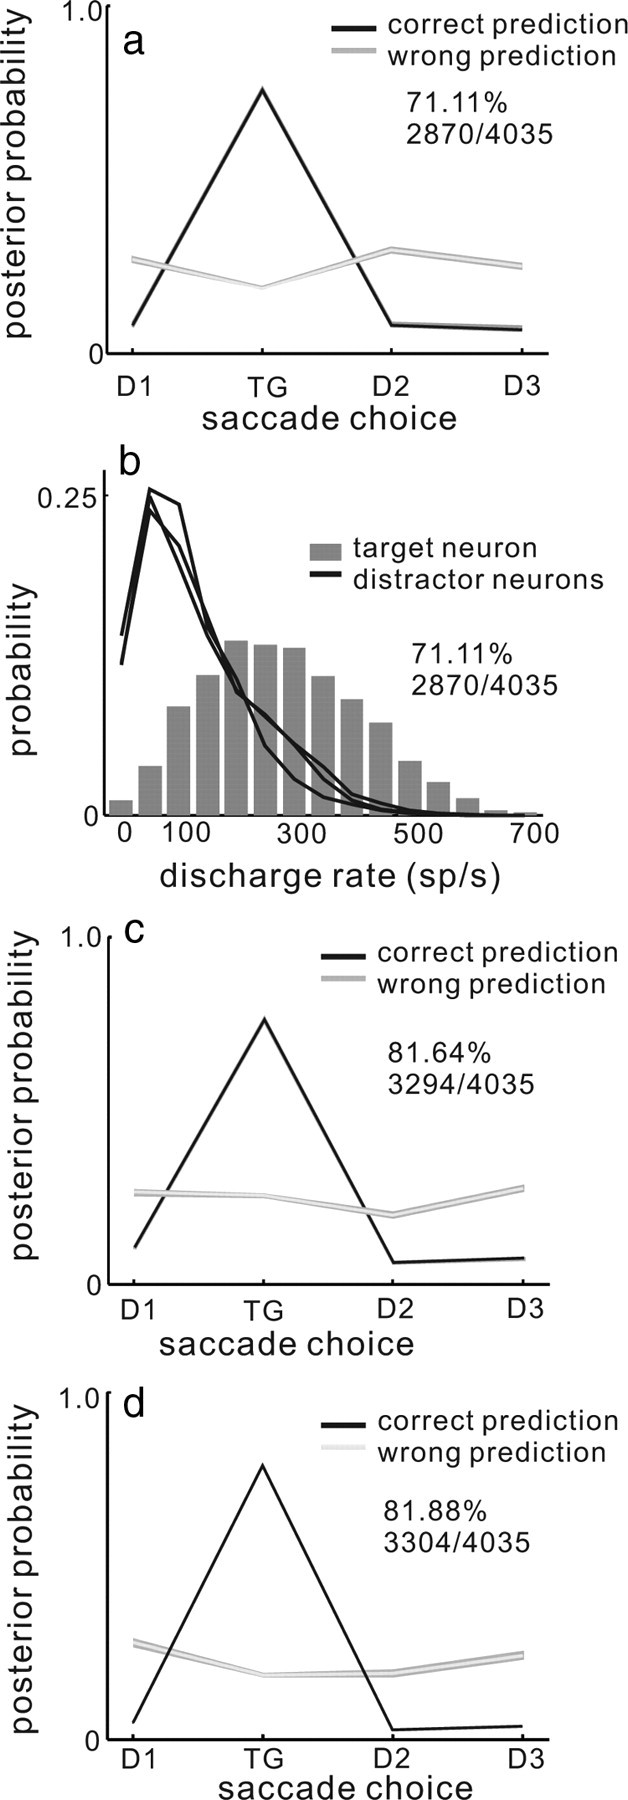
WTA and MAP models of saccade choice. a, The mean of the MAP estimates across all trials, computed using the logs of fixed Gaussians as weights is plotted for the four possible saccade choices. The black line shows the mean of the MAP estimates for the trials in which the model estimate correctly predicted the saccade choice. The gray line shows the mean of MAP estimates across all the trials in which the model estimate did not predict saccade choice correctly. The shading around the lines indicates 1 SE. This version of the MAP model could predict 71.11% (2870 of 4035 trials) of all saccade choices. b, The probability of measuring a particular discharge rate in the interval 28 to 8 ms before saccade onset in the selection task is plotted for all neurons across all 30 datasets. Black lines show probability of nonselected neuron discharge rates. The gray bars show probability of selected neuron discharge rates. The WTA model could predict 71.11% (2870 of 4035 trials) of all saccade choices. c, The same as in a except the posterior probability was computed using the log of the tuning curves of SC neurons to characterize P(r|s). Saccade choices were predicted with 81.64% (3294/4035) accuracy. d, Same as in a and c except the posterior was computed using the empirical probability distribution to characterize P(r|s). Saccade choices were correctly predicted with 81.88% (3304/4035) accuracy.