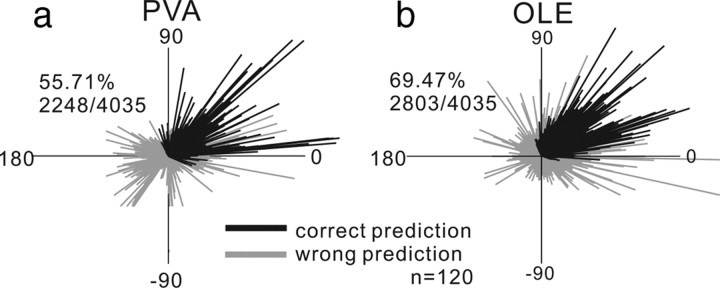
Figure 5.
Population vector average and saccade choice. a, The neuronal vector determined by Equation 13. The direction of each line indicates the direction of the population vector and the length indicates the strength of activity. The black lines show the trials in which the population vector correctly predicted saccade choice. The gray lines show the incorrectly predicted choice. PVA correctly predicted 55.71% (2248/4035) of trials. b, Same as in a for the OLE computed as described in Equation 14. The OLE correctly predicted 69.47% (2803/4035) of trials.

