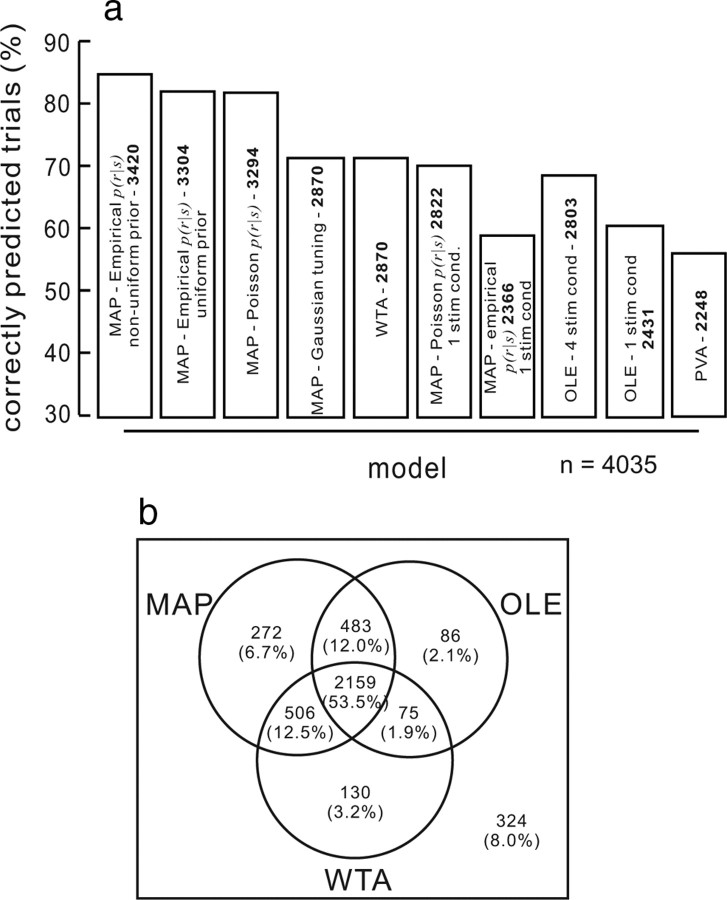
Figure 6.
Comparing models of saccade choice. a, The percentage of trials predicted correctly from each of the models is plotted. The number inside each bar indicates the number of trials (out of the total 4035) that were correctly predicted by each model. Each model result is labeled inside each bar. From left to right, the bars are as follows: MAP with empirical PDD characterization of P(r|s) determined from four stimulus condition data with the nonuniform prior; MAP with Poisson PDD characterization of P(r|s) determined from four stimulus condition data with the uniform prior; MAP with Poisson PDD constrained by the tuning curves measured from the four stimulus condition data; MAP with Gaussian tuning curves; WTA; MAP with Poisson PDD characterization of P(r|s) determined from single stimulus condition data; MAP using empirical PDD characterization of P(r|s) using single stimulus condition data; OLE optimized with four stimulus condition data; OLE optimized with single stimulus condition data; and PVA. b, Venn diagram of the percentage of trials predicted by each of the models. The MAP model in this plot is the one using the empirical PDD characterization of P(r|s) determined from the four stimulus condition data and the nonuniform prior (the first bar in the top panel). None of the models predicted 8.0% (324/4035) of the trials.

