Figure 7.

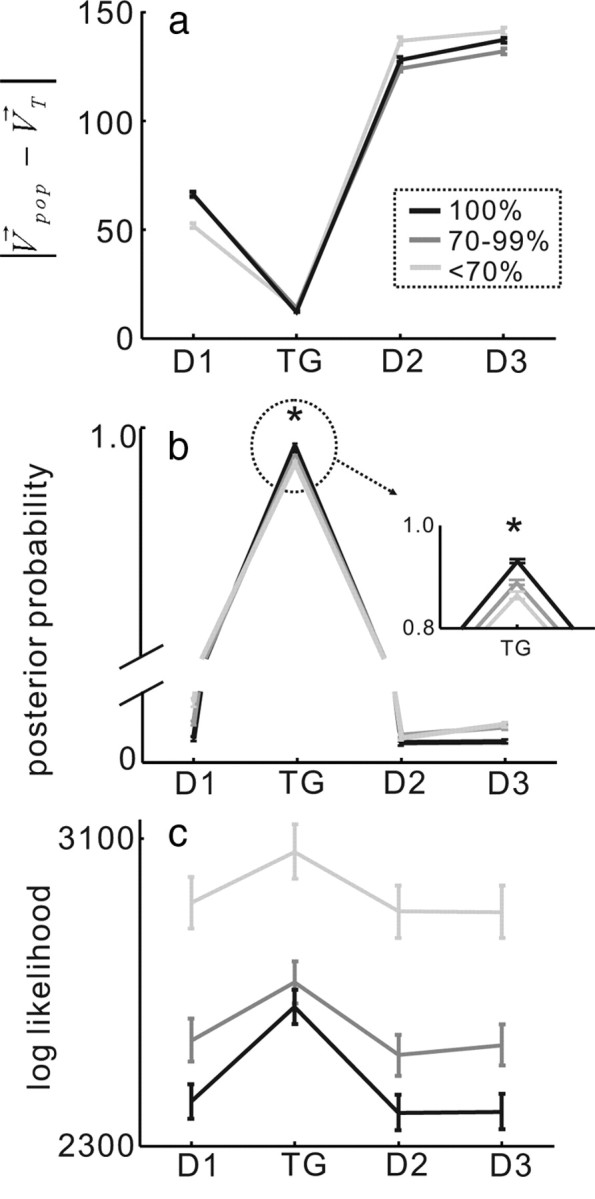
MAP estimates scale with performance accuracy. The black lines show mean angular difference for the trials in which performance was 100%. The dark gray lines show the mean angular difference for trials in which performance was 70–99% accurate. The light gray lines show the mean angular difference for trials in which performance accuracy was <70%. D1 = distractor 1; D2 = distractor 2; D3 = distractor 3; TG = saccade target choice. a, The angular difference between the direction of the prediction resulting from the OLE calculation and the actual saccade direction for trials in which performance accuracy varied. b, The mean of the MAP estimate with nonuniform prior for the four possible saccade choices, D1, TG, D2 and D3 as in a is plotted for each of the three accuracy conditions. The inset shows the region of the distribution in the dashed circle. *p < 0.05. c, Log likelihood for each of the four possible saccade choices. The arrangement is the same as in a and b.
