
Figure 8.
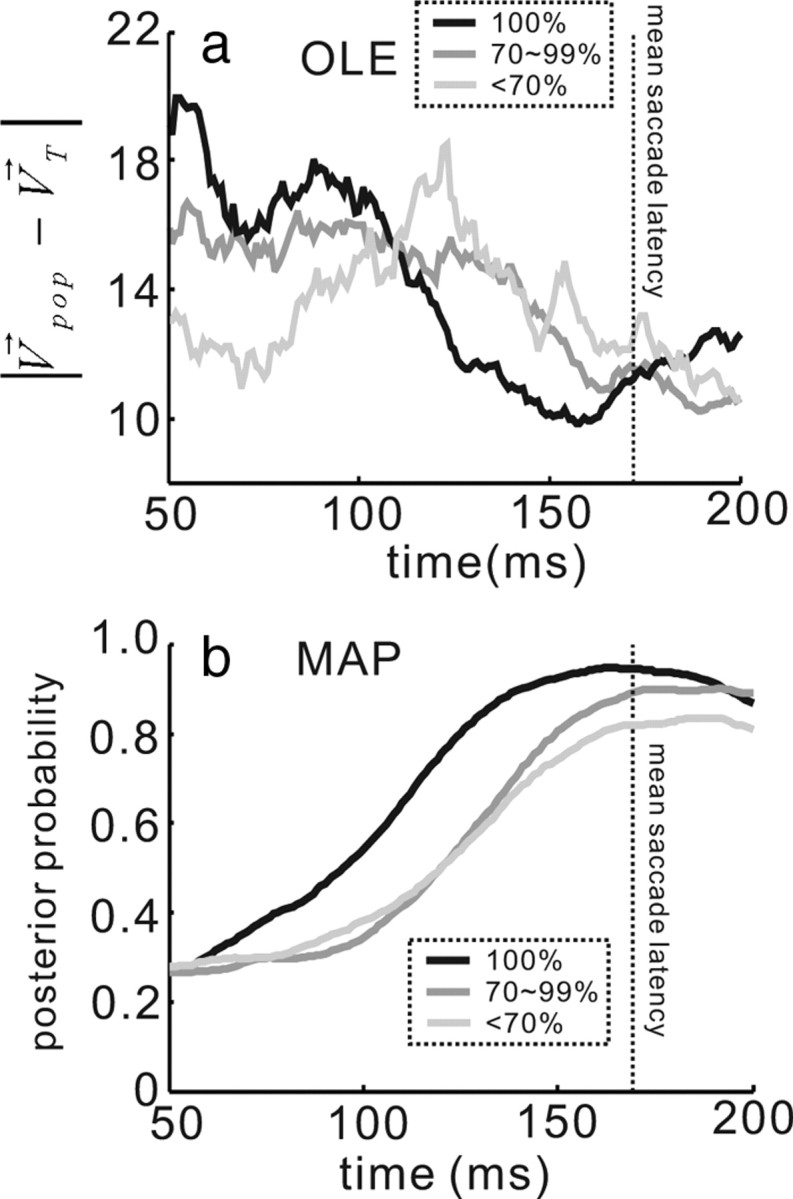
OLE and MAP predictions develop over time. a, The angular difference in the direction of the OLE vector and the saccade vector is plotted against time for the three choice accuracy levels. The traces are aligned to the time point 50 ms after the onset of the stimulus array. Black lines are from the 100% performance accuracy trials, dark gray lines are the 70–90% performance accuracy trials, and the light gray lines are the <70% performance accuracy trials. b, The mean of the MAP estimates for the saccade choice in the three levels of performance accuracy are plotted over time as in a. The vertical dotted line in both panels is the mean saccade reaction time (RT).