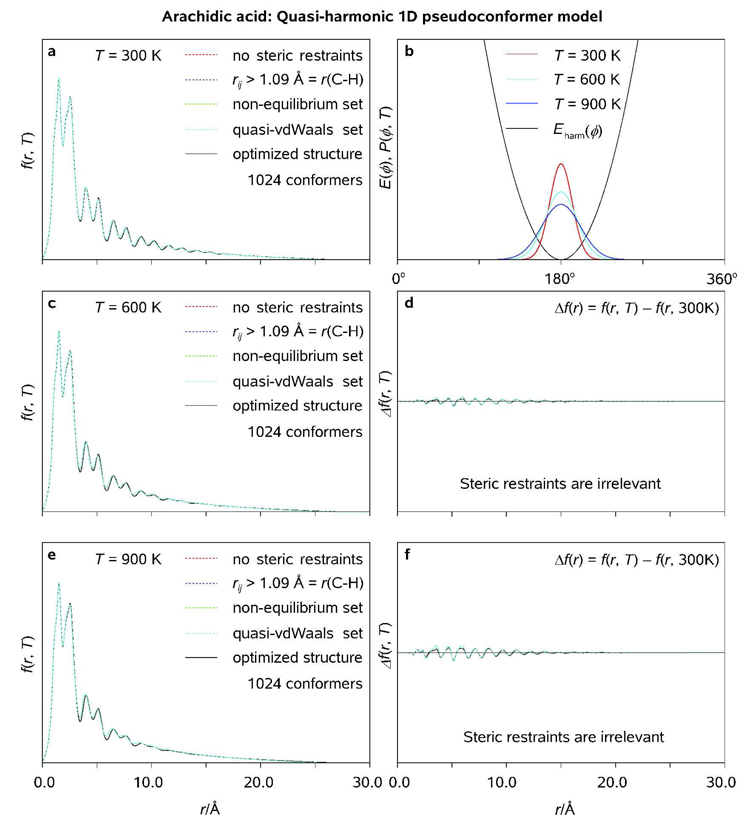
Figure 11.
Radial distribution functions (<f(r, T)>; a, c, e) and thermal probability density distribution functions (P(ϕ, T); b) as obtained for uncorrelated quasi-harmonic pseudoconformer models of arachidic acid at T = 300, 600, and 900 K using different steric tolerances (see Text); <f(r, T)> characteristic of the optimized structure of arachidic acid (symmetry group Cs) are plotted for comparison. Pertinent diffraction differences are shown as well (see Legend).

