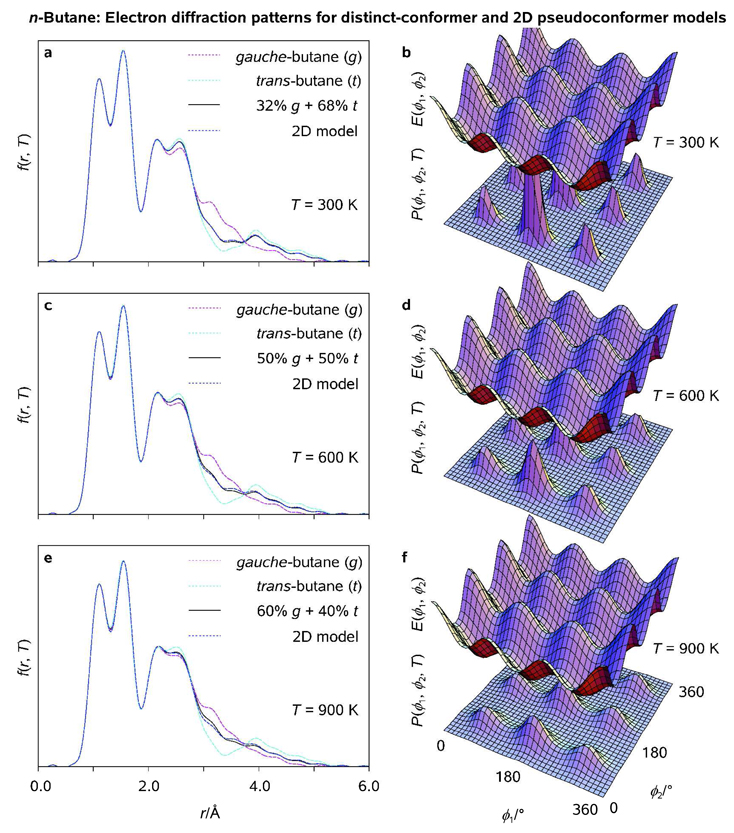
Figure 4.
Radial distribution functions (<f(r, T)>; a, c, e) and thermal probability density distribution functions (P(ϕ1, ϕ2, T); b, d, f) as obtained for fully-correlated 2D pseudoconformer models of n-butane at T = 300, 600, 900 K, respectively; <f(r, T)> characteristic of the two-conformer models of Bartell[29] and calculated potential energy surfaces E(ϕ1, ϕ2), cf. Figure 2, are plotted for comparison (see Legend).

