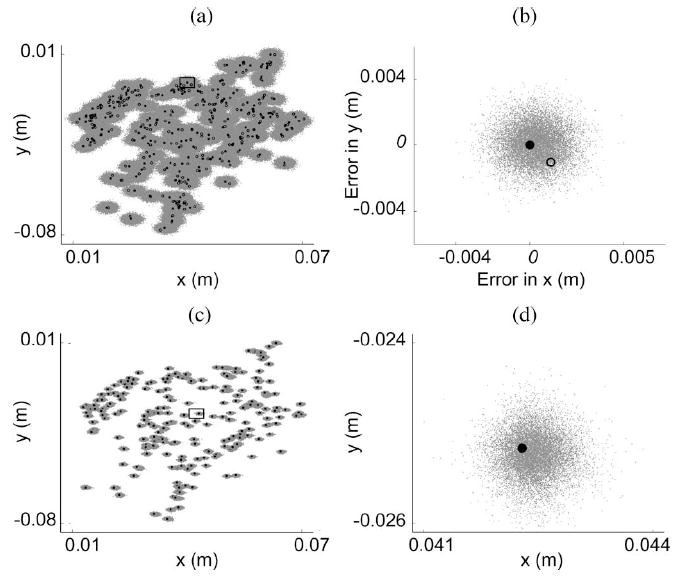
Fig. 10.

Posterior prediction [(a) and (b)] and cross-validation [(c) and (d)] results are shown for the 36-D test case 6 for two experimental outputs: x and y thumbnail coordinates. (a) Posterior predictive samples (gray points) are clustered around the true model outputs (solid circles) despite the use of noisy data [open circles; see (10)]. (b) Posterior predictive sample errors are shown for a single data point [see box in (a)]. The solid and open circles indicate the true error value of zero and offset of the noisy simulated data point, respectively. (c) Model predictions (gray points) are clustered around the cross-validation data (solid circles). (d) Close-up view of a single data point [see box in (c)] is shown.
