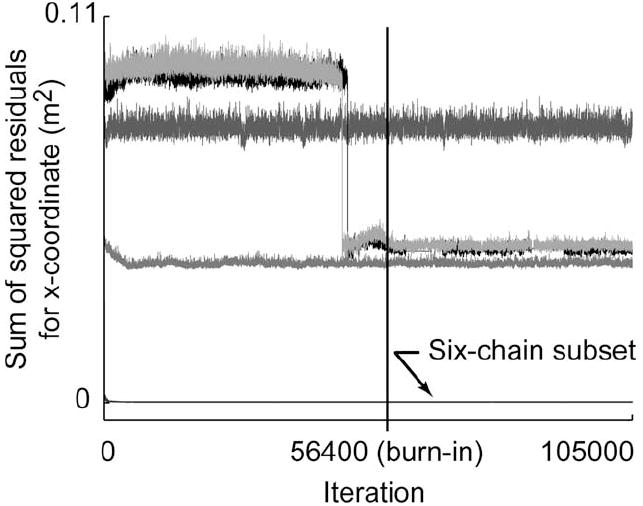
Fig. 4.

Time history of the sum of the squared residuals [summed across all data points, see numerator of (5)] is shown for a representative model output (thumbnail x-coordinate) for the 36-D test case 6. Each trace corresponds to the performance of a single Markov chain. The burn-in iteration is represented by the vertical line at iteration 56 400. The six-chain subset that located the true posterior distribution had values on the order of 2E–4m2. Four other chains had larger residuals ranging from 4E–2 to 8E–2m2, suggesting that they had found local minima.
