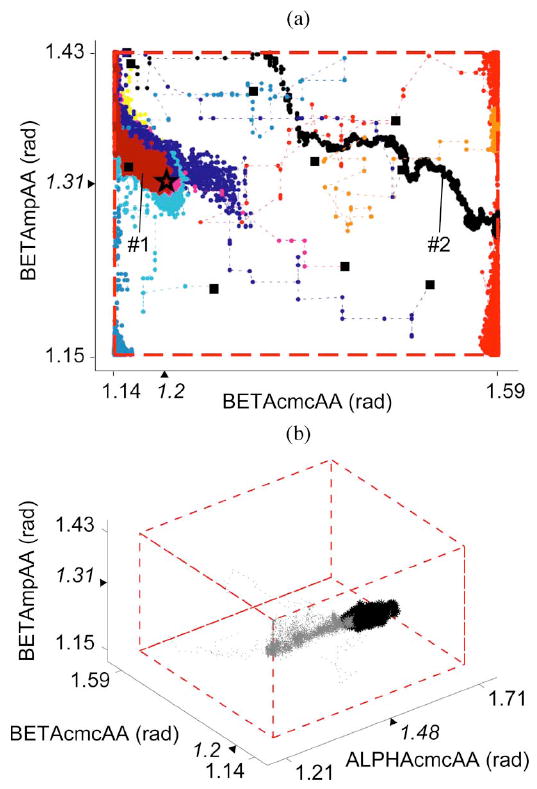
Fig. 6.

(a) Overdispersed initial conditions (solid squares) for ten independent Markov chains are shown for two representative parameters for the 36-D test case 6. Some chains (e.g., 1) located the true posterior (true parameter values marked by a star), while others (e.g., 2) found local minima. (b) History of the six-chain subset is shown for three representative parameters for the 36-D test case 6. Burn-in and pooled converged iterations are shown in gray and black, respectively. For both (a) and (b), prior distribution bounds are represented by dashed lines, and tick marks and triangles on the axes indicate the parameter bounds and true values, respectively.
