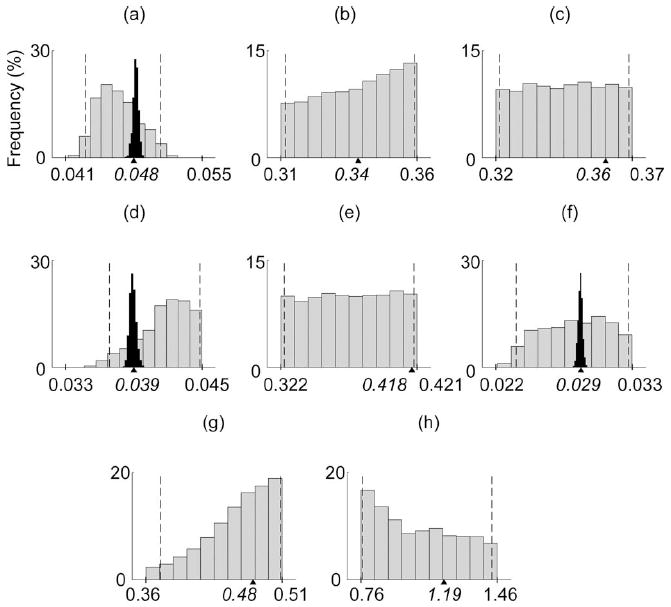
Fig. 7.

Marginal distributions are shown for the eight bone parameters [30] for the 36-D test case 6 (gray bars) and the 3-D test case 3 [black bars in (a), (d), and (f)]. Dashed lines indicate the 95% confidence intervals (for the 36-D test case 6), while tick marks and triangles on the x-axes indicate the parameter bounds and true values, respectively.
