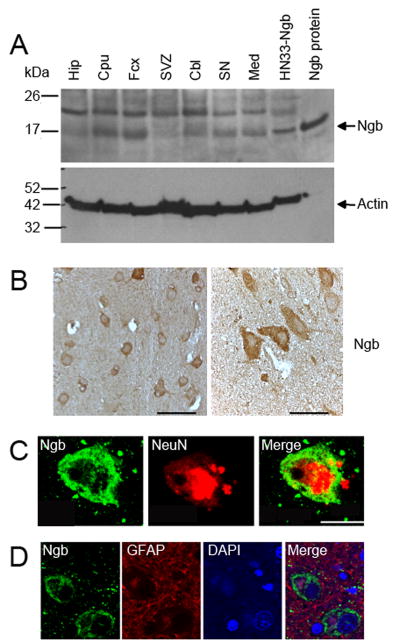
Figure 1. Ngb expression in normal human brain.
(A) Western blot of Ngb (~17 kDa) protein expression in normal human brain. The band at ~23 kDa is unidentified. Hip, hippocampus; Cpu, caudatoputamen; Fcx, frontal cortex; SVZ, subventricular zone; Cbl, cerebellum; SN, substantia nigra; Med, medulla; HN33-Ngb, Ngb-overexpressing HN33 (clonal mouse hippocampal neuron × neuroblastoma) cells; Ngb protein, authentic human Ngb. Actin was measured to control for variations in protein loading. in cerebral cortex at low (left) and high (right) magnification. Scale bars are 50 (left) and 20 (right) μm. (C) Double-label immunohistochemistry in cerebral cortex showing expression of Ngb (left, green) and NeuN (center, red), and merged image (right). Scale bar is 10 μm. (D) Double-label immunohistochemistry in cerebral cortex showing expression of Ngb (left, green) and GFAP (center left, red), DAPI-stained nuclei (center right, blue) and merged image (right). Scale bar is 10 μm.

