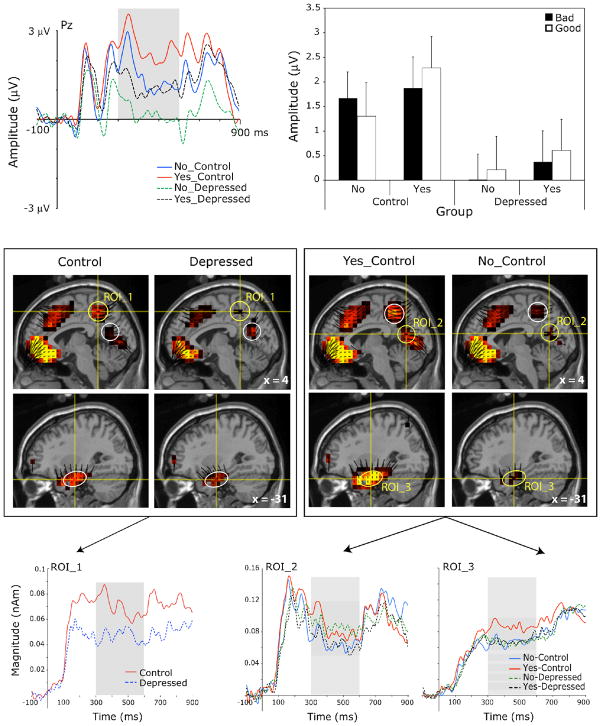
Figure 4.
Top panel, left: Grand-average scalp waveform plots from a representative channel of the P3/LPC for endorsed (Yes) and unendorsed (No) trait words for the depressed and control groups. Top panel, right: Mean P3/LPC amplitude by endorsement and valence for the depressed and control groups. Error bars indicate the standard error of the means. Middle panel: Voxel intensity and vector orientation for three source regions (ROIs 1–3) contributing to the scalp P3/LPC (450 ms), grand-averaged across all conditions for the control and depressed groups (left) and for the endorsed (Yes) and unendorsed (No) categories for the control group alone (right). ROI 1 comprised 13 dipole voxels within BA7 and BA31. ROI 2 comprised 13 dipole voxels within BA31, BA30, and BA23. ROI 3 comprised 23 dipole voxels within BA20, BA28, BA35, and BA36. Bottom panel, left: Mean source waveforms for ROI 1 indicating changes in current source magnitude over time for the control and depressed groups (Group main effect, p < 0.041). Bottom panel, middle and right: Mean source waveforms for ROI 2 and ROI 3 for endorsed (Yes) and unendorsed (No) trait words for control and depressed groups (Endorsement main effect for the control group only in both regions). Gray shading in scalp and source waveform plots indicates the scalp P3/LPC window.

