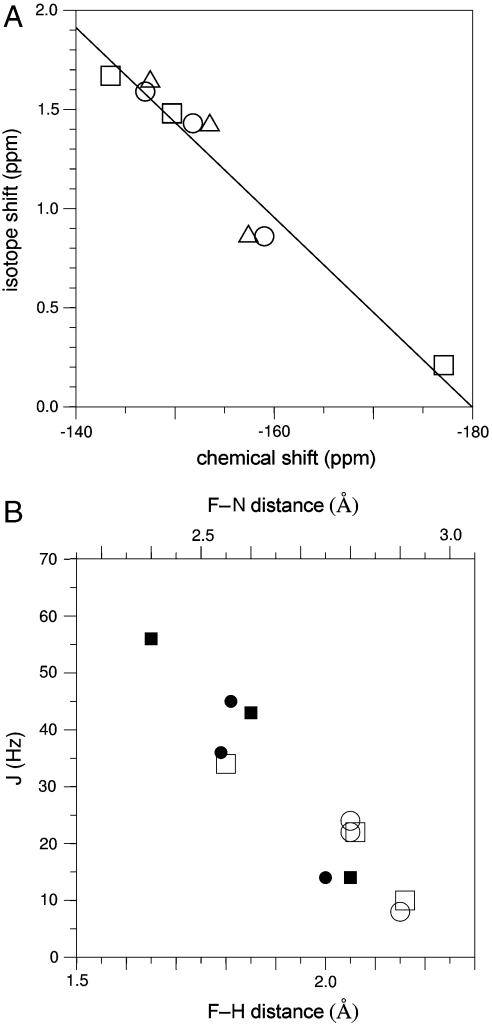
Fig. 5.
Correlation of NMR parameters and their relationships to the crystalline state. (A) Correlation plot showing the relationship between chemical shift (ppm) and isotope shift (, ppm) for the resonances of the complex (circles), the complex (triangles) and the complex (squares). Linear regression analysis gives . (B) Correlation plot showing the relationships between (filled symbols) and (open symbols) couplings with the corresponding internuclear distances derived from structures of the (circles) and (squares) (10) complexes. The F-N distances are derived directly from the experimental coordinates, and the F-H distances are determined to hydrogens positioned using the program XPLOR.

