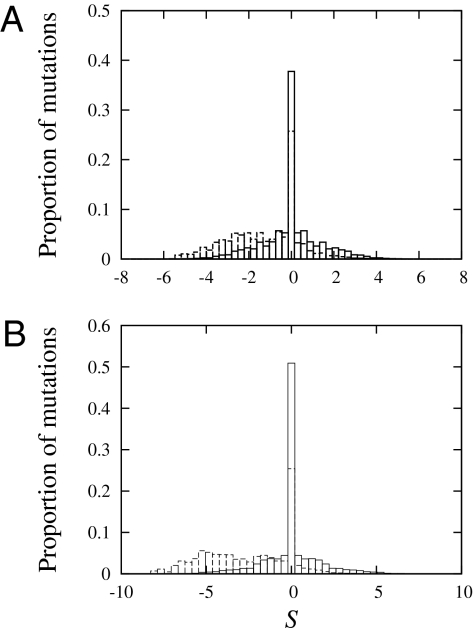
Fig. 3.
Distributions of scaled selection coefficients (S) at equilibrium of the Markov process under the MG-MutSelDP model applied to the Globin 17–144 data set in A and Rhod 38–300 in B. The dashed-line histogram displays the proportion of mutations among all possible mutations having the coefficient value in the abscissa, whereas the solid-line histogram displays the proportion of mutations among all substitutions having the coefficient value in the abscissa.

