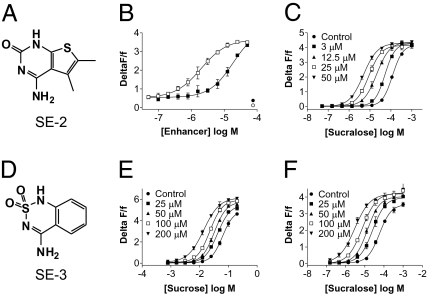
Fig. 3.
Identification of additional PAMs selective for sucralose and sucrose. (A) Chemical structure of SE-2. (B) Dose–response effect of SE-1 (□) and SE-2 (■) on the sucralose-evoked increase in [Ca2+]int. Cells were stimulated with SE-1 and SE-2 at concentrations up to 75 μM. At 220 sec, a suboptimal concentration of sucralose (10 μM final concentration) was then added onto the cells and the subsequent change in [Ca2+]int was monitored. SE-1 and SE-2 dose-dependently enhanced the sucralose effect with EC50’s of 3.0 ± 1.1 μM (average ± SD; n = 6) and 22 ± 4.5 μM (average ± SD; n = 3), respectively. At 75 μM, SE-2 (●) and SE-1 (○) did not show agonist activity. (C) SE-2 increases the sucralose potency in the assay. Sucralose dose–response effects were performed, using a coapplication protocol (see Materials and Methods), in the presence of increasing concentrations of SE-2, as depicted on the graph. In this representative experiment, the sucralose EC50 value was decreased from 120 μM to 52, 21, 8.9, and 4.9 μM at 3, 12.5, 25, and 50 μM SE-2, respectively. (D) Chemical structure of SE-3. (E) SE-3 increases the sucrose potency in the assay. Sucrose dose–response effects were performed, using a coapplication protocol, in the presence of increasing concentrations of SE-3, as depicted on the graph. In this representative experiment, the sucrose EC50 value was decreased from 62 mM to 42, 32, 23, and 14 mM at 25, 50, 100, and 200 μM SE-3, respectively. (F) SE-3 increases the sucralose potency in the assay. Sucralose dose–response effects were performed, using a coapplication protocol, in the presence of increasing concentrations of SE-3, as depicted on the graph. In this representative experiment, the sucralose EC50 value was decreased from 59 μM to 26, 14, 7.5, and 3.0 μM at 25, 50, 100, and 200 μM SE-3, respectively. Data points in B, C, E, and F correspond to an average ± SD of a triplicate determination.

