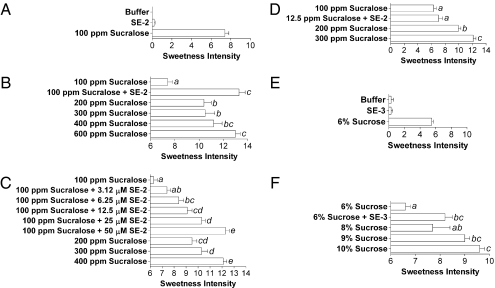
Fig. 4.
Evaluation of SE-2 and SE-3 effects in human taste tests. (A) SE-2 is not sweet on its own. Panelists (n = 12) were asked to rate the sweetness intensity of the depicted solutions. A solution containing 100 μM SE-2 was not sweet and produced the same sweetness intensity score as the buffer control. (B) SE-2 enhances the sweetness intensity of a sucralose solution. Panelists (n = 12) were asked to rate the sweetness intensity of the depicted solutions. The data set was subjected to an analysis of variance followed by a Tukey's honestly significant difference test. Solutions producing significantly different sweetness intensity scores from one another (P < 0.05) were assigned different letters, depicted on the graph. SE-2 (100 μM) enhanced the sweetness intensity score of a 100-ppm sucralose solution from 7.4 ± 0.4 to 13.3 ± 0.5 (average ± SEM) or to levels equivalent to those produced by the 400- and 600-ppm sucralose solutions. (C) SE-2 sweet taste enhancement effect is dose dependent. Panelists (n = 13, two replicates) were asked to rate the sweetness intensity of the depicted solutions and the data set was analyzed as described in B. SE-2 at concentrations of 3.12, 6.25, 12.5, 25, and 50 μM enhanced the sweetness intensity score of a 100-ppm solution from 6.3 ± 0.3 to 7.4 ± 0.3, 8.4 ± 0.4, 9.1 ± 0.4, 10.3 ± 0.3, and 12.3 ± 0.3 (average ± SEM), respectively. (D) SE-2 enhances lower concentrations of sucralose. Panelists (n = 14, two replicates) were asked to rate the sweetness intensity of the depicted solutions and the data set was analyzed as described in B. Adding 100 μM SE-2 to a 12.5-ppm sucralose solution produced the same sweetness intensity score as the 100-ppm sucralose solution. (E) SE-3 is not sweet on its own. Panelists (n = 14) were asked to rate the sweetness intensity of the depicted solutions. A solution containing 100 μM SE-3 was not sweet and produced the same sweetness intensity score as the buffer control. (F) SE-3 enhances the sweetness intensity of a sucrose solution. Panelists (n = 14) were asked to rate the sweetness intensity of the depicted solutions and the data set was analyzed as described in B. SE-3 (100 μM) enhanced the sweetness intensity score of a 6% sucrose solution from 6.6 ± 0.2 to 8.2 ± 0.3 (average ± SEM) or to levels equivalent to those produced by the 8, 9, and 10% sucrose solutions.

