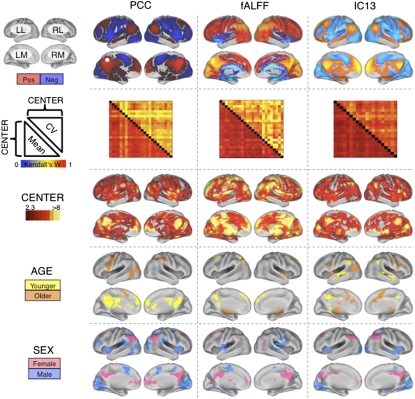
Fig. 1.
Independent center-, age-, and sex-related variations detected in R-fMRI measures of functional connectivity and amplitude fluctuation. The first row depicts group-level maps for representative seed-based (column 1) and ICA-based (column 3) functional connectivity analyses (SI Results), as well as fALFF (column 2). Group-level maps were derived from one-way ANOVA across 1,093 participants from 24 centers (factor: center; covariates: age and sex). All group-level maps depicted were corrected for multiple comparisons at the cluster level using Gaussian random-field theory (Z > 2.3; P < 0.05, corrected). For each measure, the second row shows robust between-center concordances (Kendall's W), with the voxelwise coefficients of variation above the diagonal and the voxelwise means below the diagonal. Kendall's W concordance between any two centers was calculated across all voxels in the brain mask for the mean (or coefficient of variation) connectivity map across all participants included in each center. Rows 3, 4, and 5 depict voxels exhibiting significant effects of center, age, and sex, respectively, as detected by one-way ANOVA. “Male” refers to significantly greater connectivity (or amplitude, i.e., fALFF) in males; similarly, “female” refers to significantly greater connectivity (or amplitude) in females. “Older” refers to significantly increasing connectivity (or amplitude) with increasing age, whereas “younger” refers to significantly increasing connectivity (or amplitude) with decreasing age. “Pos” refers to positive functional connectivity, and “neg” refers to negative functional connectivity. The PCC seed region is indicated by a white dot. (Top Left) Surface map legend: LL, left lateral; RL, right lateral; LM, left medial; RM, right medial. All surface maps are rendered on the PALS-B12 atlas in CARET (http://brainvis.wustl.edu).

