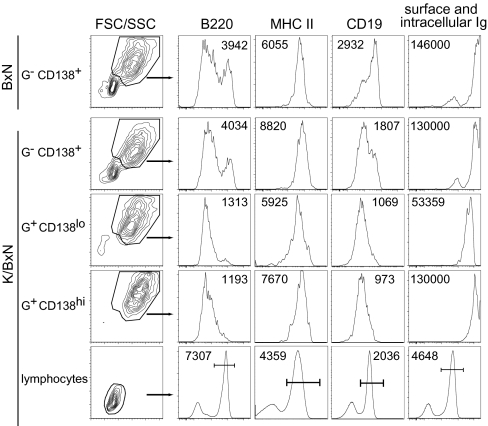
Fig. 4.
Phenotyping of GPI-specific plasma cells. Each population of cells from 7-week-old K/BxN or BxN mice was defined as in Fig. 3 [GPI intracellular staining (G)]. The number in each histogram is the mean fluorescence intensity (MFI) of all cells or gated cells when the gate is indicated by a bar. Representative of three independent experiments.

