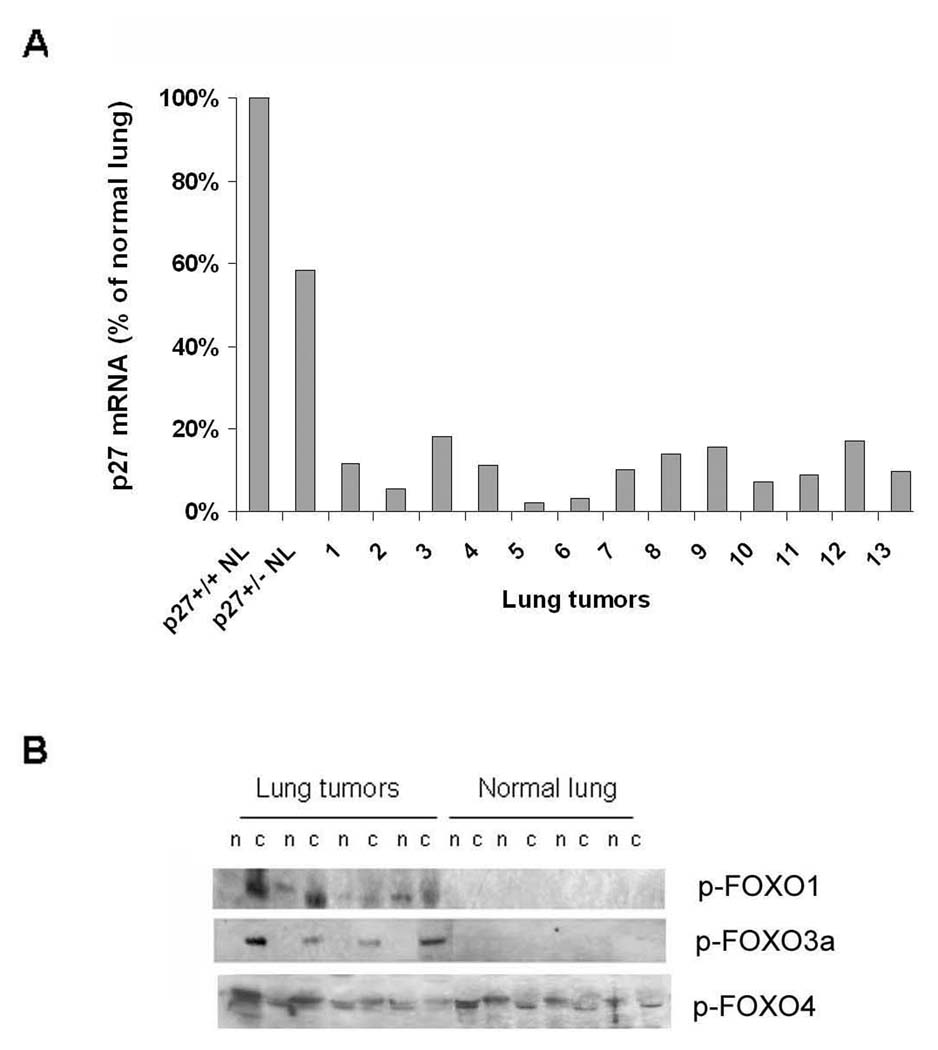
Figure 6. Reduced p27 transcript and increased p-Akt and p-FOXO in lung tumours.
(A) Bar graph of p27 mRNA expression levels derived from real-time PCR using total RNA isolated from lung tumours and normal lung (NL) from wild type mice. (B) Western blot shows expression levels of phosphorylated forkhead family members, p-FOXO1, p-FOXO3a, and p-FOXO4a in lung tumour extracts compared to normal lung. n: nuclear extracts, c: cytoplasmic fractions.

