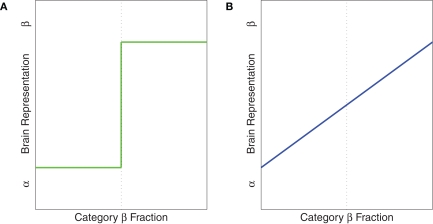
Figure 1.
Idealized illustrations of two possible ways a brain area could represent stimuli, when categories α and β have been learned. (A) Categorical representations. (B) Graded, noncategorical representations. The y-axis could be measured in several ways. Low values indicate the brain is in the “α” state. High values indicate the brain is in the “β” state.

