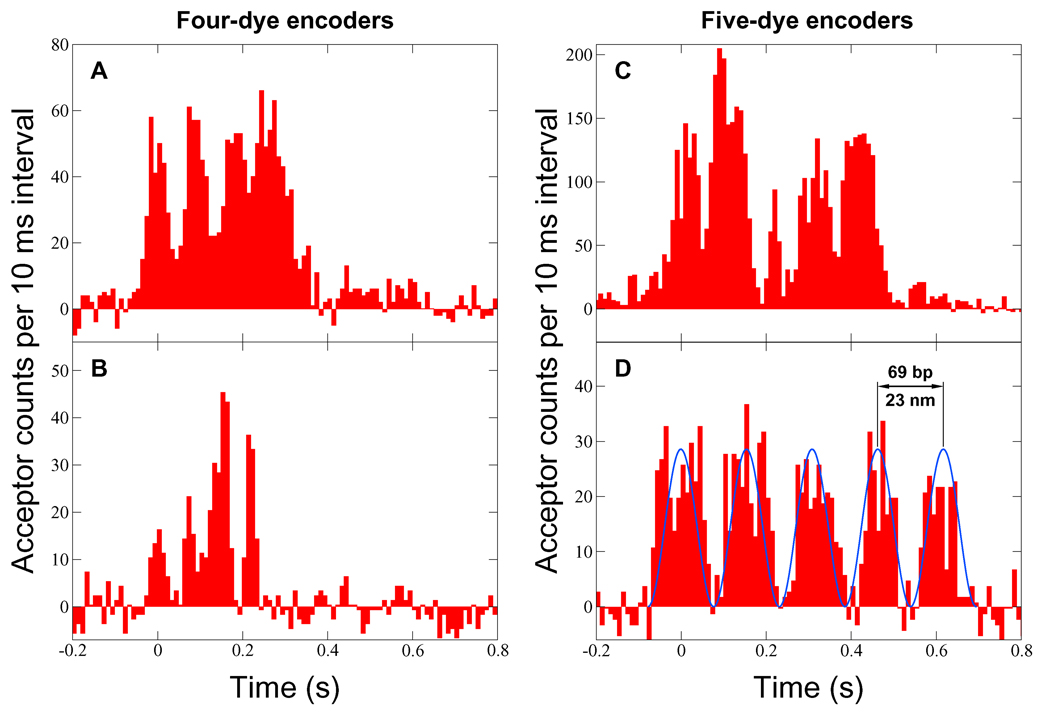
Figure 3.
Acceptor fluorescence signal as a function of time (background subtracted). A signal peak is produced each time the donor-labeled helicase passes an acceptor dye on its encoder. For each event, the unwinding speed was determined by fitting a function of the form A cos2 [πf(t − t0)] to the data using least squares. One such fit is illustrated in (D). The speeds were (A) 759 ± 13 bp/s, (B) 950 ± 24 bp/s, (C) 665 ± 12 bp/s, and (D) 447 ± 6 bp/s. A complete event indicates that a single labeled helicase traveled at least 276 bp (A and B) or 345 bp (C and D). This implies processivity much greater than has previously been measured for DnaB alone.

