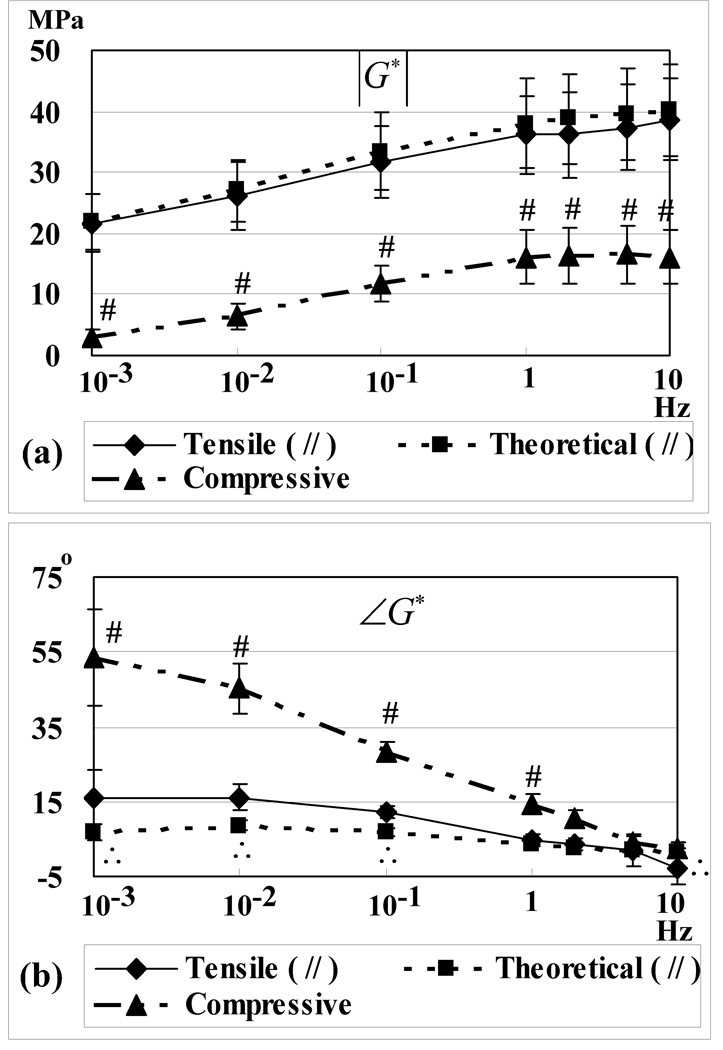
Figure 5.
Experimental dynamic moduli | G* | (a) and phase angles ∠G* (b) in tension and compression, and corresponding theoretical predictions (tensile case), as a function of loading frequency. Tensile results are presented for // samples only, as ⊥ samples exhibit a virtually identical response. Symbols denote significant statistical differences between dynamic tension and compression (#), and between experimental results and theoretical predictions (∴) (p<0.05).

