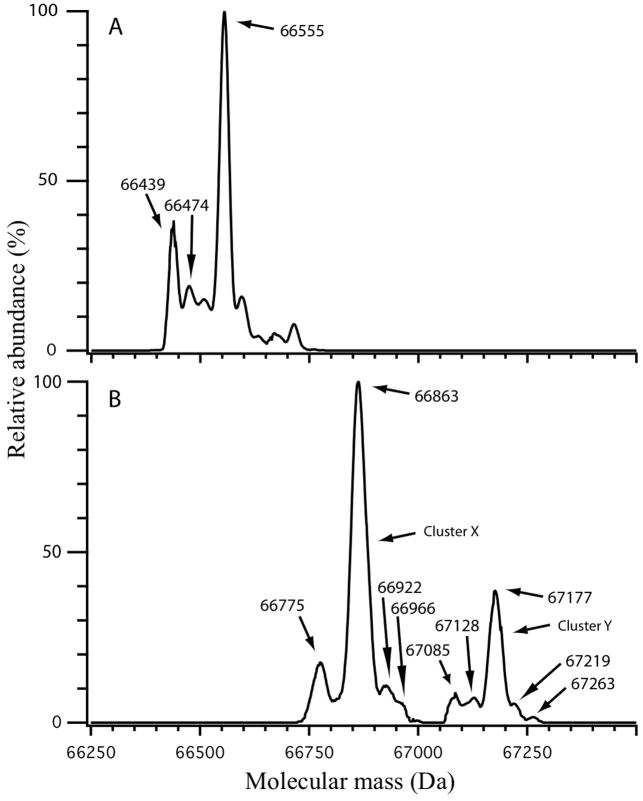
Figure 2.
Deconvoluted mass spectra of commercial HSA (A) and the BPDE-HSA standard (B). Masses in (A) at 66,439 Da and 66,555 Da are mercaptalbumin and HSA which has been cysteinylated at HSA-Cys34. The mass difference between cluster X in (B) at 66,683 Da and cysteinylated HSA in (A) is 308 Da and between cluster Y in (B) at 67,177 Da and cysteinylated HSA is 622 Da. Since the theoretical mass change after addition of one mol of BPDE to one mol of HSA is 302.3 Da, clusters X and Y probably represent cysteinylated HSA which has been modified with one and two BPDE molecules, respectively.

