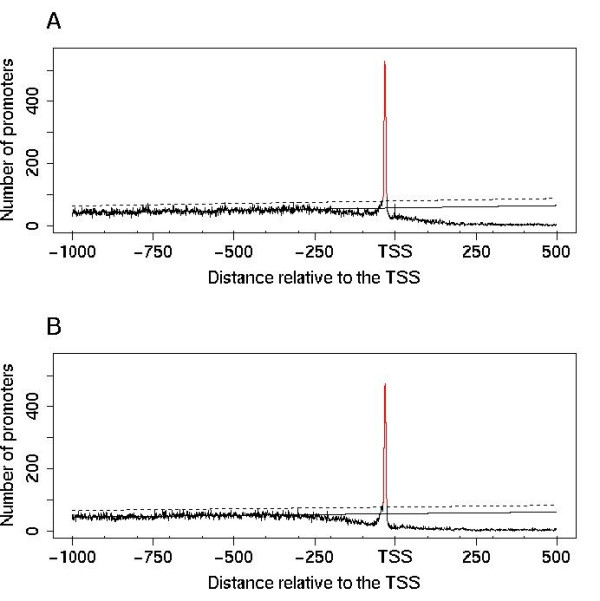
Figure 1.

Distribution of TATAWA in plant promoters aligned relative to the TSS. The canonical TATA-box defines the TATAWA-PLM. The distribution model is learned in the [-1000, -300] region where the base line (continuous line) and the upper bound of the confidence interval (dashed line) are estimated and applied to the [-300, 500] region. Distributions are shown for the Arabidopsis thaliana set containing 14927 promoters (A) and for the Oryza sativa set containing 18012 promoters (B). The TATAWA-PLM is preferentially positioned 32 bases upstream of the TSS with a [-39, -26] functional window in both genomes. A. thaliana and O. sativa are characterized by an SMS of 21 and 19 respectively.
