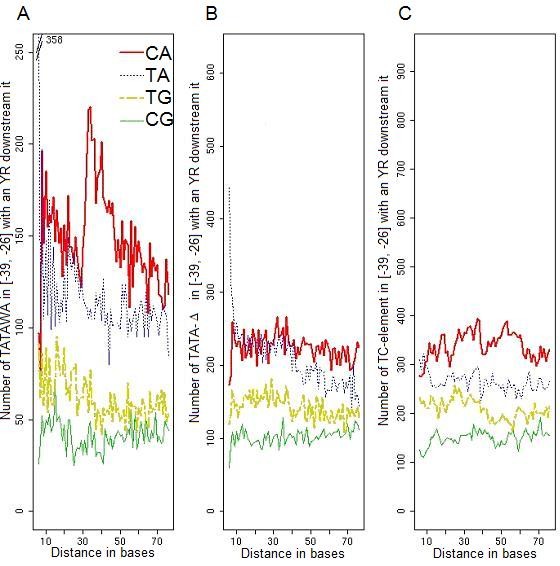
Figure 6.

Distance between the four YR-TSSs relative to the three classes of [-39,-26]-PLMs in A. thaliana promoters. We computed the distance observed between each PLM of a given class of [-39,-26]-PLMs and all dinucleotides CA (red line), TG (yellow line), TA (blue line) and CG (green line) present downstream of the PLMs. The distance on the x-axis corresponds to the number of bases between the first base of a [-39,-26]-PLM and the first base of an YR-TSS. For instance, a distance of 8 bases between a TATAWA and a CA corresponds to the TATAWANNCA sequence in a promoter. We analysed the three gene sets containing a unique class of [-39,-26]-PLMs and represented the distance between (A) the TATAWA-, (B) the TATAΔ-, (C) the TC[-39,-26]-PLMs and the four YR-TSS sequences. Analyses done for each PLM led to the same representation as the global analysis done for the PLM class it belongs to: for instance, the analysis for the TTCTTC-PLM led to a (C) representation.
