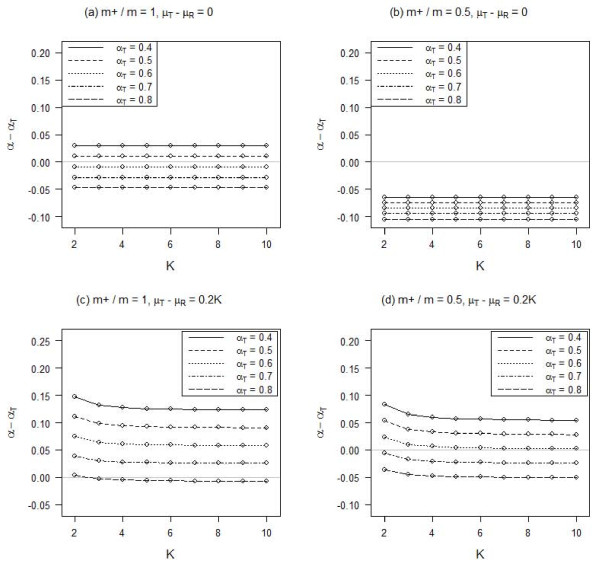
Figure 4.

Influence of the number of item response categories (K) on Cronbach's alpha (αT for the true responses) for different proportions of positive polarity items (m+/m) and mean differences between the true and random responses (μT-μR). There are 20% random responses and 5% fixed responses.
