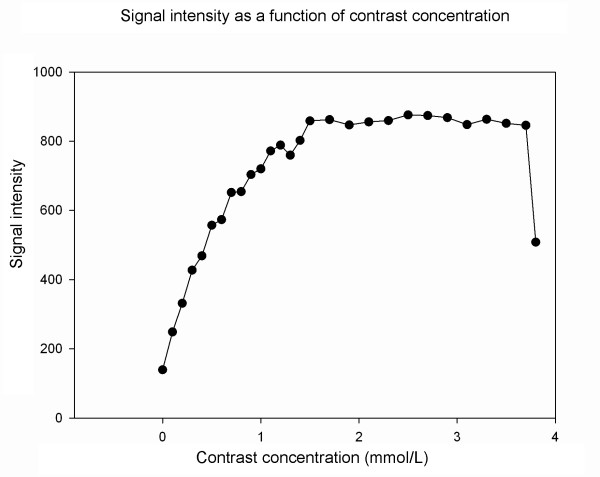
Figure 1.
Optimization of concentration of the contrast agent. MR scanning of tubes containing contrast agent at different concentrations was performed. The signal intensity was plotted as a function of concentration. The signal intensity increased with contrast concentration up to 2 mmol/L followed by a steady decline so we decided to use 2.5 mmol/L in subsequent MRA studies. Data were acquired using a 3D gradient-echo sequence with the following parameters: thickness 1 mm; TR 23.1 ms; TE 1.6 ms and excitation flip angle 30°.

