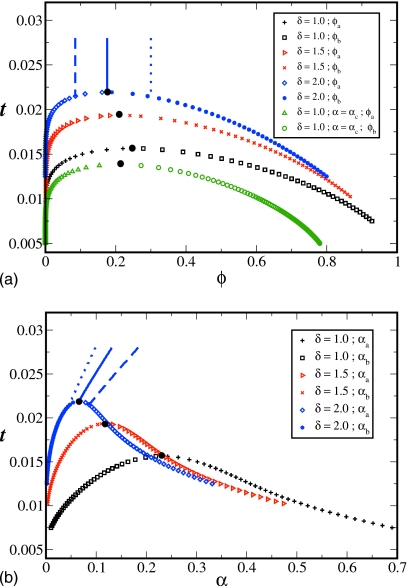
Figure 1.
Temperature-concentration (a) and temperature-charge (b) phase diagrams for a polymer solution with variable degree of ionization. Parameters are the following: N=1000, aχ=1.0, and δ=1.0, 1.5, and 2.0. Vertical lines correspond to the homogeneous phase for δ=2.0: ϕ=0.085 (dashed), ϕ=ϕc=0.176 (solid), and ϕ=0.300 (dotted). Higher concentration corresponds to lower degree of ionization. Critical points are given by black dots. The lowest curve in (a) is for fixed charge αc=0.23 (chosen to be the value at the critical point with variable charge) at δ=1.0.

