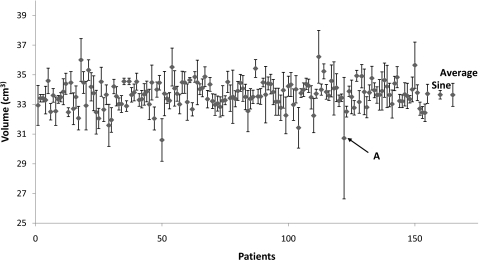
Figure 2.
Volumes detected from a 2 cm radius tumor and 2 cm peak-to-peak tumor motion for 155 patients. The volume detected from a sine rpm wave is indicated on the right of the graph, along with the standard deviation averaged over all phases of the sine wave. The average tumor volume is shown on the far right, as well as the average standard deviation values of the volumes. The breathing trace of the value indicated by the arrow A is shown in Fig. 5a.

