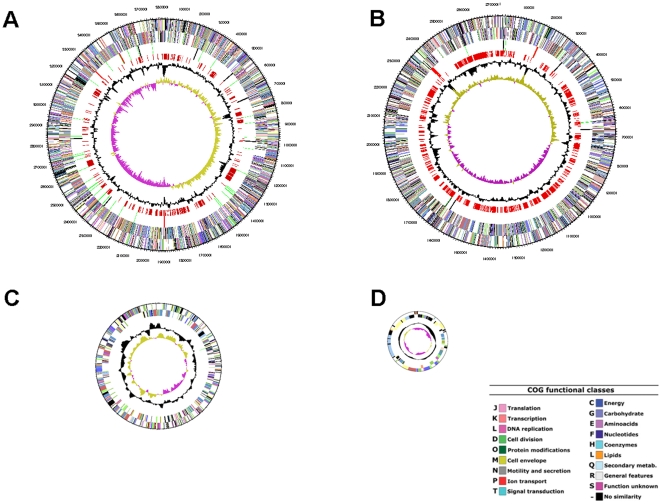
Figure 1. Circular representations of the four replicons of the C. necator genome.
1A: chromosome 1; 1B: chromosome 2; 1C: megaplasmid; 1D: plasmid pPJ4. Circle 1 (from outside to inside): COG assignments for CDSs on the plus strand. Circle 2: COG assignments for CDSs on the minus strand. Circle 3: RNA genes (green = tRNAs; red = rRNAs; black = other RNAs). Circle 4 (for chromosome 1 and 2, only): genes not found in C. eutropha H16, C. metallidurans CH34, or R. solanacearum GMI1000. Circle 5: % G+C. Circle 6: GC skew (G-C/G+C). Colors indicate the following: dark gray, hypothetical proteins; light gray, conserved hypothetical and unknown function; brown, general function prediction; red, replication and repair; green, energy metabolism; blue, carbon and carbohydrate metabolism; cyan, lipid metabolism; magenta, transcription; yellow, translation; orange, amino acid metabolism; pink, metabolism of cofactors and vitamins; light red, purine and pyrimidine metabolism; lavender, signal transduction; and blue sky, cellular processes.

