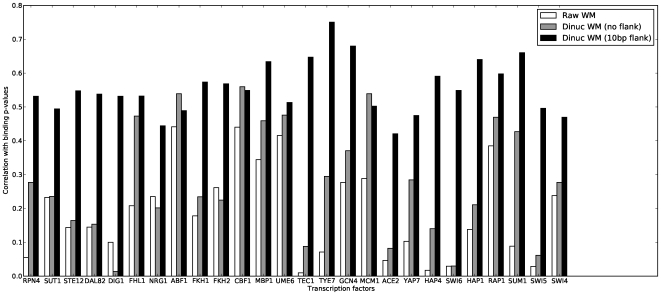
Figure 2. The relative performance of PWMs and DWMs in predicting binding targets in yeast.
The figure shows Pearson correlation coefficients of binding site predictions with ChIP binding  -values reported by Harbison et al.
[19], using the “raw” position weight matrices from MacIsaac et al.
[20], dinucleotide weight matrices with the same “width” as the “raw” matrices, and dinucleotide weight matrices with a 10bp “flanking sequence” on either side of the input matrices. Details are in Materials and Methods.

