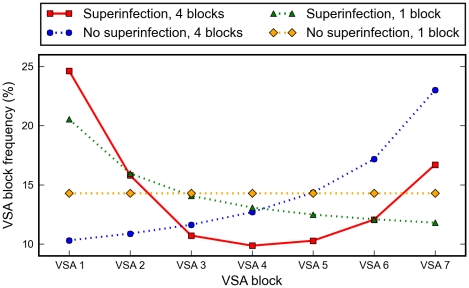
Figure 3. Frequency distributions of VSAs in the parasite population at endemic equilibrium.
Opposing selection pressures favour VSA blocks at each end of the dominance hierarchy (solid red line), suggesting a mechanism behind the two clusters displayed in Fig. 3 of [35]. Superinfection selects for high-dominance VSAs (compare solid red line and dotted blue line). When parasites contain multiple VSA blocks, acquired immunity selects for low-dominance variants (compare solid red line and dotted green line). Without superinfection and only a single VSA block per parasite, there is no frequency difference between the different VSA blocks (dotted yellow line).

