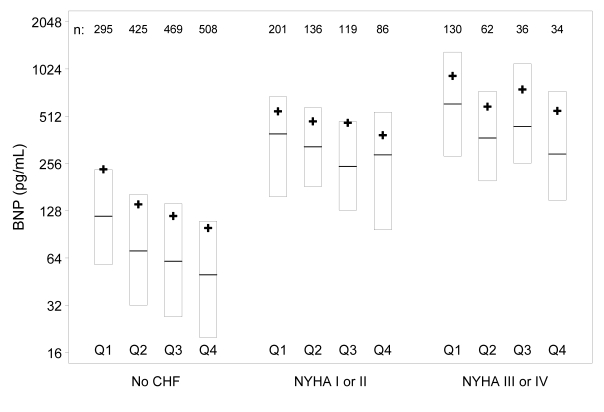
Figure 1.
BNP by CHF group and eGFR quartile (Q1–Q4). Subjects within CHF group are divided by the overall eGFR distribution (eg, Q1 = lowest 25% for eGFR in all groups, Q4 = highest 25%). Within these eGFR subgroups, box plots extend from the 25th to the 75th percentile for BNP, with a bar at the median and a “+” indicating the subgroup mean BNP. The number of subjects in each subgroup is shown at the top of the figure. Increasing severity of underlying congestive heart failure was associated with increasing BNP (P<0.001). In addition, there was a strong and highly significant inverse association between BNP and eGFR (P<0.001), with higher BNP levels observed in those with lower eGFR.

