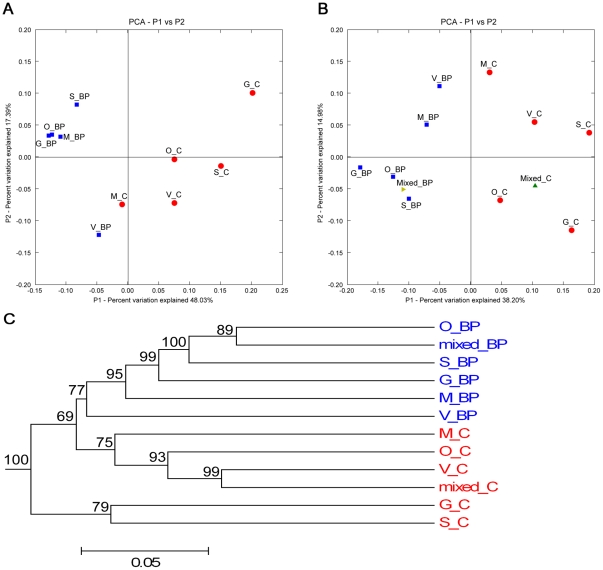
Figure 4. UniFrac analysis of V3 16S sequences from canine fecal samples.
(A) Principal Component Analysis scatter plot of individual samples by dietary treatment (control = red circles; beet pulp supplemented = blue squares). (B) Principal Component Analysis scatter plot of individual samples combined with pooled DNA samples (pooled control = green triangle; pooled beet pulp = gold triangle). (C) A jackknifed clustering of the environments in the UniFrac dataset (100 permutations). The numbers next to the nodes represent the number of times that particular node was observed (out of 100) in a random sampling from the whole dataset.

