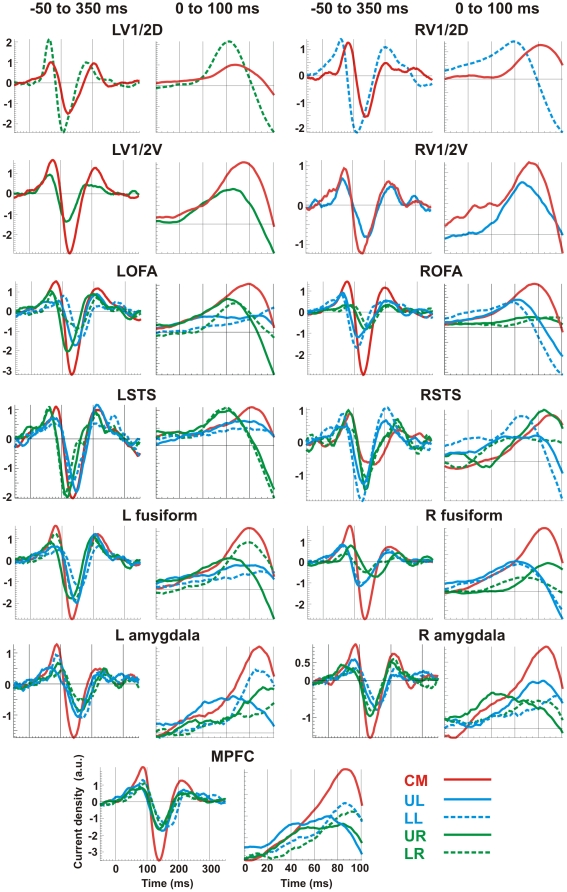
Figure 4. Regional activation time courses (ACV) for images presented at the five positions.
Curves averaged on image onset across all seven subjects with a smoothing window of 20 ms. Odd columns are ACV plots for 50 ms before to 350 ms after image onset while even columns are the magnified view of odd columns (0 to 100 ms).

