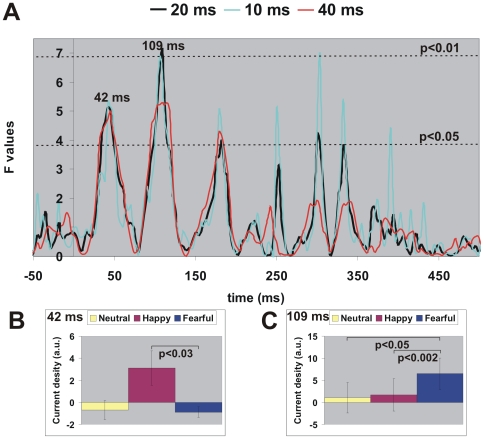
Figure 5. The calculation of latencies for emotion separation.
(A) Effect of window length (10, 20 and 40 ms) on statistical significance (F values) from AVONA applied to right STS ROI time courses from centrally presented images. Dotted lines denote significance levels of p<0.05 and p<0.01. (B–C) Post-hoc T-test shows how the emotions are separated at the peak latencies in (A): 42 ms and 109 ms for ROI curves smoothed with a 20-ms window. Error bar denotes ±1 standard error.

