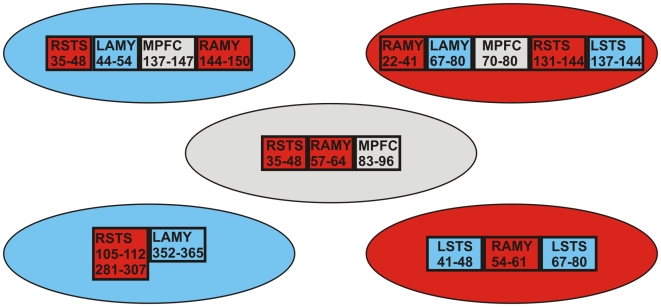
Figure 6. First time ranges for emotion separation in bilateral amygdala (AMY) and STS, and MPFC.
The times are printed inside the boxes in millisecond. Images were presented at either the center or one of the quadrants. Gray, blue and red ovals represent fovea, left and right visual field presentation, respectively. In case of STS and AMY activations, boxes in the same color as the background oval denote ipsilateral activity while in different color denote contralateral activity.

