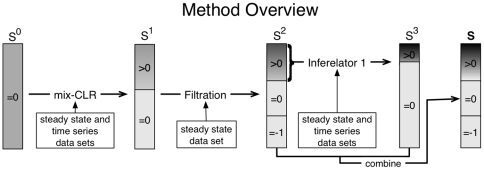
Figure 1. Method outline.
For each regulatory interaction,  , we define a confidence score
  , where
  indicates the step in our pipeline. We store these confidence scores in a corresponding
  matrix,
  (eq. 2), which we depict in the figure as a sorted list (from high to low confidence) of regulatory interactions. We schematically represent true positives (TPs) density (within any subset) as a gray scale, where black indicates high TP density. All possible pair-wise regulatory interactions are first scored using mixed-CLR, resulting in a matrix
  . We then filter out the least likely regulatory interactions based on the knock-out and knock-down steady-state observations, resulting in a matrix
  (the confidence score of each removed regulatory interaction was set to minus one, and thus sent to the back of the list). Lastly, we evaluate regulatory interactions in the TP enriched subset using Inferelator 1.0, by building an ODE model for each target gene. The kinetic weights from these ODE models were converted into confidence scores (
 ) and combined with
  to produce the final ranked list,
  (eq. 32). The regulatory interactions scored in
  , when ranked from high to low, represent our final ranking for each regulatory interaction.

