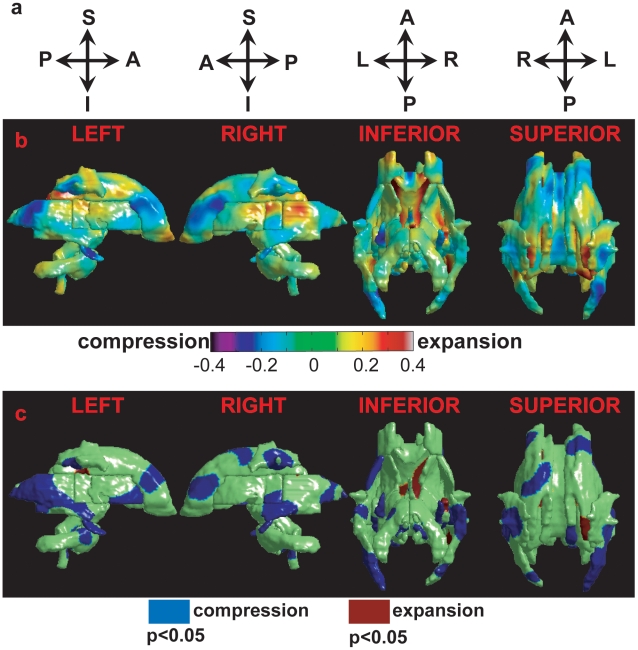
Figure 3. Deformation maps of the white matter tracts.
Row (a) illustrates the anatomical orientation of the corresponding column. Row (b) shows the group difference map in the log-Jacobian determinant between the healthy control subjects and patients with AD. Warm color denotes regions with shape expansion in the AD group; while cool color represents regions with shape compression. Row (c) illustrates shape abnormalities of the deep white matter tracts in the patients with AD relative to the healthy control subjects. Blue denotes the regions with significant surface compression in the AD group compared with the control group, while red colors the regions with significant surface expansion in the AD group relative to the control group. Left, right, inferior, and superior views are respectively illustrated from the left to the right.

