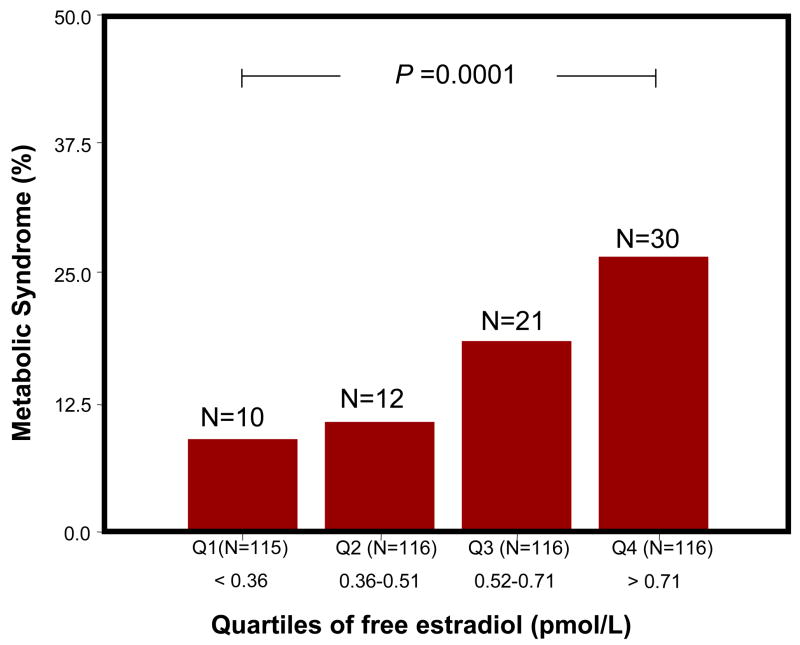
Figure 3.
Free Estradiol and Metabolic Syndrome. Percent distribution of the participants (vertical axis) with metabolic syndrome (red bars) according to quartiles of free estradiol (horizontal axis). The number of participants with metabolic syndrome according to quartiles of free estradiol are indicated in parentheses above the bar graphs.

