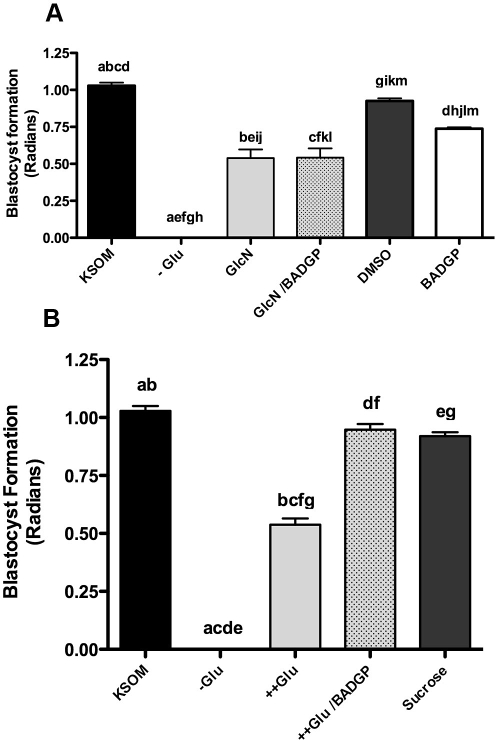
FIG. 5.
A) Effect of glucosamine (GlcN) in the presence and absence of 2 mM BADGP on blastocyst formation. Zygotes were cultured from 18 to 96 h post-hCG in control KSOM (0.2 mM glucose; KSOM), KSOM-glucose (-Glu), KSOM-glucose supplemented with 0.2 mM GlcN (GlcN), 0.2 mM GlcN in the presence of 2 mM BADGP (GlcN/BADGP). A subset of zygotes were also cultured in KSOM supplemented with either 2 mM BADGP (BADGP) or DMSO. Bars represent mean ± SEM from three separate experiments each with 30 zygotes per treatment. Factorial ANOVA determined no interexperimental variation and no interaction (P > 0.05). Means were further analyzed to determine differences between different treatments. Means with the same lowercase letters are statistically different (a–i, k: P < 0.01; j, l, m: P < 0.05; Tukey post hoc test). B) Effect of hyperglycemia in the presence of 2 mM BADGP on blastocyst formation. Zygotes were cultured from 18 to 96 h post-hCG in control KSOM (KSOM), KSOM-glucose (-Glu), KSOM supplemented with 27 mM glucose (++Glu), or 27 mM glucose supplemented with 2 mM BADGP (++Glu/BADGP). 26.8 mM sucrose in KSOM (containing 0.2 mM glucose; Sucrose) was used as an osmotic control. Bars represent mean ± SEM from three separate experiments each with 30 zygotes per treatment. Factorial ANOVA determined no interexperimental variation and no interaction (P > 0.05). Means with the same lowercase letters are statistically different (P < 0.001; Tukey post hoc test).

