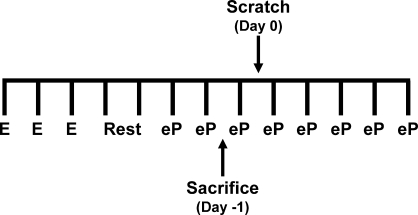
FIG. 1.
Schematic of microarray analysis experimental design. Microarray analysis was performed using an abbreviated artificial decidual response protocol in which the uteri were harvested 30 h after the first E2 plus P4 injection. Each vertical bar marks 1 day. E, estrogen injection (100 ng); Rest, no injection; eP, estrogen plus progesterone injection (6.7 ng and 1 mg, respectively).

