
Figure 6.
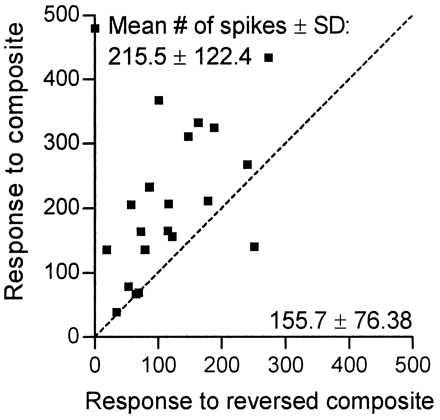
Effect of playing composite call stimuli in reverse. For 21 neurons (▪; range of response ratios = 35–1108%), responses to the particular best composite and the corresponding stimulus played in reverse could be studied quantitatively. The scatter plot indicates total spike numbers (200 stimulus repetitions less spontaneous activity) for each stimulus condition and neuron. For each neuron, the time window for spike counting was individually adjusted (range = 40–200 ms) to fully include both responses to forward and backward stimulation (dashed bisector = no-change level). Differences in spike numbers (mean ± SD) are statistically significant (two-tailed paired t test, P < 0.01), indicating that responses to reversed composites are significantly reduced compared with the original.