

Abstract
Deep brain stimulation in the subthalamic nucleus is an effective and safe surgical procedure that has been shown to reduce the motor dysfunction of patients with advanced Parkinson’s disease. Bilateral subthalamic nucleus deep brain stimulation, however, has been associated with declines in cognitive and cognitive–motor functioning. It has been hypothesized that spread of current to nonmotor areas of the subthalamic nucleus may be responsible for declines in cognitive and cognitive–motor functioning. The aim of this study was to assess the cognitive–motor performance in advanced Parkinson’s disease patients with subthalamic nucleus deep brain stimulation parameters determined clinically (Clinical) to settings derived from a patient-specific computational model (Model). Data were collected from 10 patients with advanced Parkinson’s disease bilaterally implanted with subthalamic nucleus deep brain stimulation systems. These patients were assessed off medication and under three deep brain stimulation conditions: Off, Clinical or Model based stimulation. Clinical stimulation parameters had been determined based on clinical evaluations and were stable for at least 6 months prior to study participation. Model-based parameters were selected to minimize the spread of current to nonmotor portions of the subthalamic nucleus using Cicerone Deep Brain Stimulation software. For each stimulation condition, participants performed a working memory (n-back task) and motor task (force tracking) under single- and dual-task settings. During the dual-task, participants performed the n-back and force-tracking tasks simultaneously. Clinical and Model parameters were equally effective in improving the Unified Parkinson’s disease Rating Scale III scores relative to Off deep brain stimulation scores. Single-task working memory declines, in the 2-back condition, were significantly less under Model compared with Clinical deep brain stimulation settings. Under dual-task conditions, force tracking was significantly better with Model compared with Clinical deep brain stimulation. In addition to better overall cognitive–motor performance associated with Model parameters, the amount of power consumed was on average less than half that used with the Clinical settings. These results indicate that the cognitive and cognitive–motor declines associated with bilateral subthalamic nucleus deep brain stimulation may be reversed, without compromising motor benefits, by using model-based stimulation parameters that minimize current spread into nonmotor regions of the subthalamic nucleus.
Keywords: Parkinson’s disease, deep brain stimulation, force control, cognitive function, dual-task, computational modelling
Introduction
Bilateral deep brain stimulation (DBS) of the subthalamic nucleus is an effective therapy for improving the cardinal motor signs of advanced Parkinson’s disease (The Deep Brain Stimulation Study Group, 2001). Although bilateral subthalamic nucleus DBS is considered safe, an emerging concern is the potential negative consequences it may have on cognitive functioning and overall quality of life (Saint-Cyr et al., 2000; Freund, 2005; Rodriguez-Oroz et al., 2005). A recent report indicates patients’ perceptions of their day-to-day function is improved slightly by deep brain stimulation; however, caregivers perceived the patient as exhibiting subtle ‘declines’ in day-to-day functioning (Duff-Canning et al., 2008).
Several long-term studies, examining changes in cognitive function, suggest that bilateral subthalamic nucleus DBS results in varying levels of decline in overall cognitive functioning, including verbal fluency (Funkiewiez et al., 2004; Contarino et al., 2007) and working memory (Rodriguez-Oroz et al., 2005; Schupbach et al., 2005). Although some of these long-term results may be due to natural progression of Parkinson’s disease, they provide compelling evidence to suggest that bilateral subthalamic nucleus DBS may adversely affect different features of cognitive functioning, and bring into question earlier views that subthalamic nucleus DBS does not impair cognition. For example, measures of verbal fluency, learning and memory exhibited significant declines when comparing bilateral subthalamic nucleus DBS to presurgery or OFF-DBS scores (Woods et al., 2002). In a meta-analysis that included data from 1398 patients with bilateral subthalamic nucleus deep brain stimulation, cognitive problems were seen in 41% of patients (Temel et al., 2006). Cognitive problems varied from a moderate deterioration in verbal memory to significant declines in executive functioning.
Cognitive declines following bilateral subthalamic nucleus DBS have been reported previously; however, the frequency of decline, especially in early DBS studies, may be underestimated due to variation in the difficulty of the cognitive testing across studies (Hershey et al., 2004). The majority of studies examining the cognitive effects of subthalamic nucleus deep brain stimulation, have used relatively simple neuropsychological tests suitable for use in a clinical environment. Therefore, reports of no or minimal effect of subthalamic nucleus DBS on cognitive functioning may be explained by a lack of difficulty in test selection or the artificial environment, free of distraction, in which they are completed. Hershey and colleagues (2004) reported that bilateral subthalamic nucleus stimulation decreased working memory under cognitively demanding conditions. We recently added to those results by examining cognitive and motor function individually and simultaneously under different levels of cognitive demands (Alberts et al., 2008). As working memory demands increased, cognitive, motor and cognitive–motor function decreased during bilateral compared with unilateral subthalamic nucleus DBS (Alberts et al., 2008). On the basis of our results, we hypothesized that the spread of current to nonmotor regions of the subthalamic nucleus may be responsible for the disruption in cognitive, motor and cognitive–motor function during bilateral subthalamic nucleus deep brain stimulation.
Given its small size, stimulation within the subthalamic nucleus, even with electrode contacts located predominately within the sensorimotor territory, can result in the spread of current to limbic and associative areas as well as to surrounding structures and fibre systems that may also affect cognition (Maks et al., 2009). The electric field generated by DBS is non-discriminately applied to all the neural elements surrounding the electrode, and these stimulation effects are subsequently transmitted throughout the basal ganglia and thalamocortical networks (Asanuma et al., 2006; Phillips et al., 2006; Karimi et al., 2008). Thus, diminished cognitive function during subthalamic nucleus DBS may be due to nonselective activation of nonmotor pathways within and around the subthalamic nucleus.
The interplay between the patient and clinician performing the DBS parameter selection is critical in defining the balance between therapeutic benefit and stimulation-induced side effects. However, clinical DBS programming is typically done without the opportunity to visualize the spread of stimulation relative to the surrounding anatomy. In turn, current spread into nontarget areas could occur without overt clinical signs, but still result in side effects not commonly assessed during typical clinical programming sessions. To address this potential problem, we recently developed Windows-based software tools that enable 3D visualization of the volume of tissue activated by DBS as a function of the stimulation parameters and electrode location in the brain (Butson et al., 2007b; Miocinovic et al., 2007). Our working hypothesis was that quantitative theoretical predictions could be used to define stimulation parameter settings, customized to the patient, maximizing stimulation of a determined target area(s) and minimizing stimulation spread to nontarget areas.
The aim of this project was to compare the effectiveness of two DBS programming strategies, standard Clinical and Model-based, on cognitive–motor performance in advanced Parkinson’s disease patients under dual-task conditions. The primary criterion for the selection of Model DBS parameters was to maximize the stimulation of target areas in the subthalamic region while minimizing stimulation of associative/limbic (ventral–medial) sections of the subthalamic nucleus. The target areas were defined as the dorsal subthalamic nucleus and white matter region dorsal to the subthalamic nucleus (Fig. 1) (Butson et al., 2007a; Maks et al., 2009). It was hypothesized that minimizing spread of current to the nonmotor regions of the subthalamic nucleus and focusing current spread to areas previously shown to produce ideal therapeutic benefit would minimize cognitive–motor declines under dual-task conditions without compromising improvement in motor function.
Figure 1.

Patient-specific model of DBS. (A) Stereotactic coordinate system was defined relative to the imaging data. (B) Microelectrode recording data were entered into the model (thalamic cells, yellow dots; subthalamic cells, green dots; substantia nigra cells, red dots). (C) 3D brain atlas was fitted to the neuroanatomy and neurophysiology (yellow volume, thalamus; green volume, subthalamic nucleus). (D) DBS electrode was positioned in the model. (E) Theoretical ellipsoid target volume. Data presented for Patient 1.
Methods
Participants
A total of 10 participants with advanced Parkinson’s disease between the ages of 51 and 72 years (mean 58.6) participated in this study. Table 1 contains patient demographics and time since DBS surgery and Table 2 contains Clinical and Model DBS parameters. All patients had undergone simultaneous bilateral subthalamic nucleus DBS surgery at the Cleveland Clinic at least 14 months prior to study participation. Surgical procedures for DBS implantation have been reported in detail previously (Machado et al., 2006). Stimulation parameters for DBS devices were clinically determined using a standard approach for assessing the relative effect of individual contacts at varying voltages. Standard pulse widths (60–90 µs) and frequencies (130 Hz) are used while each contact was made cathodal against the case, which was anodal. The combination of contact, pulse width and frequency that maximized motor benefit at the lowest voltage without side effects as determined through clinical evaluation was selected for chronic stimulation. These methods are similar to those described by Moro and colleagues (2006). Modifications in stimulation parameters were made as necessary in follow-up clinic visits to optimize motor benefit. Stimulation parameters were stable at least 6 months prior to study participation. The programming of stimulators was overseen by an experienced DBS programming team consisting of a programming nurse and movement disorders neurologist specializing in Parkinson’s disease. Participants needed to make verbal responses during the working memory test; therefore, patients with dysarthria or speech impairment were excluded. Prior to data collection, all participants signed an informed consent approved by the Cleveland Clinic Institutional Review Board. All patients were reimbursed $100 for their travel and participation.
Table 1.
Patient demographics and UPDRS-III scores during Off, Clinical and Model DBS conditions and the percent change from Off to Clinical and Off to Model DBS
| Patient | Gender | Age (years) | DBS duration | UPDRS-III score |
UPDRS-III (%) |
|||
|---|---|---|---|---|---|---|---|---|
| (months) | Off | Clinical | Model | O to clinical | Off to model | |||
| 1 | F | 52 | 14 | 61 | 32 | 35 | 47.54 | 42.62 |
| 2 | M | 51 | 40 | 65 | 30 | 40 | 53.85 | 38.46 |
| 3 | M | 54 | 26 | 50 | 31 | 31 | 38.00 | 38.00 |
| 4 | M | 63 | 38 | 56 | 35 | 32 | 37.50 | 42.86 |
| 5 | M | 71 | 29 | 61 | 26 | 30 | 57.38 | 50.82 |
| 6 | M | 53 | 17 | 44 | 26 | 18 | 40.91 | 59.09 |
| 7 | M | 72 | 35 | 51 | 31 | 29 | 39.22 | 43.14 |
| 8 | M | 51 | 33 | 55 | 30 | 27 | 45.45 | 50.91 |
| 9 | M | 61 | 45 | 68 | 28 | 31 | 58.82 | 54.41 |
| 10 | M | 58 | 14 | 56 | 31 | 32 | 44.64 | 42.86 |
| Mean | 58.60 | 29.10 | 56.70 | 30.00 | 30.50 | 46.33 | 46.32 | |
| SD | 7.55 | 10.55 | 6.90 | 2.61 | 5.35 | 7.53 | 6.70 | |
Table 2.
Clinical and model stimulation parameters for all patients
| Patient | Clinical settings |
Model settings |
||||||
|---|---|---|---|---|---|---|---|---|
| Contact | Voltage (V) | Pulse width (μs) | Frequency (Hz) | Contact | Voltage (V) | Pulse width (μs) | Frequency (Hz) | |
| Left stimulation parameters | ||||||||
| 1 | 2−C+ | 3.2 | 90 | 130 | 3−C+ | 1.8 | 60 | 130 |
| 2 | 2−C+ | 3.2 | 90 | 185 | 2−C+ | 2.6 | 60 | 130 |
| 3 | 2−3+ | 3.5 | 60 | 135 | 2−C+ | 2.3 | 60 | 130 |
| 4 | 2−3+ | 3.6 | 60 | 135 | 2−C+ | 1.8 | 60 | 130 |
| 5 | 2−3+ | 3.6 | 90 | 135 | 2−C+ | 2.6 | 60 | 130 |
| 6 | 2−C+ | 3.0 | 60 | 130 | 2−C+ | 2.4 | 60 | 130 |
| 7 | 1−3+ | 3.6 | 90 | 185 | 2−C+ | 2.5 | 60 | 130 |
| 8 | 1−C+ | 3.2 | 90 | 135 | 2−C+ | 2.4 | 60 | 130 |
| 9 | 1−2−C+ | 2.9 | 60 | 130 | 2−C+ | 1.8 | 60 | 130 |
| 10 | 1−C+ | 3.2 | 60 | 185 | 2−C+ | 2.4 | 60 | 130 |
| Right stimulation parameters | ||||||||
| 1 | 2−3+ | 4.0 | 90 | 130 | 2−C+ | 2.0 | 60 | 130 |
| 2 | 1−C+ | 3.6 | 60 | 185 | 2−C+ | 2.2 | 60 | 130 |
| 3 | 1−2+ | 3.5 | 60 | 135 | 2−C+ | 2.6 | 60 | 130 |
| 4 | 1−3+ | 3.3 | 60 | 135 | 2−C+ | 2.8 | 60 | 130 |
| 5 | 2−3+ | 3.9 | 90 | 135 | 2−C+ | 2.8 | 60 | 130 |
| 6 | 2−C+ | 3.2 | 60 | 130 | 2−C+ | 2.6 | 60 | 130 |
| 7 | 2−C+ | 3.6 | 90 | 185 | 3−C+ | 1.5 | 60 | 130 |
| 8 | 2−C+ | 3.2 | 60 | 135 | 2−C+ | 1.8 | 60 | 130 |
| 9 | 1−2−C+ | 2.9 | 60 | 130 | 2−C+ | 2.4 | 60 | 130 |
| 10 | 2−C+ | 3.2 | 60 | 185 | 2−C+ | 2.0 | 60 | 130 |
Apparatus
A 6 degree of freedom force–torque transducer (Mini-40 Model, ATI Industrial Automation, Garner, NC, USA) was used to measure normal force (Fz; grip) during a force-tracking motor task. Grip force was measured with a resolution of 0.06 N at a sampling rate of 128 Hz. A customized LabView program developed by our laboratory was used to collect and display force data to the participant.
The n-back task
Various forms of the n-back task have been used in a number of previous studies (Owen et al., 2005). The n-back task used in this study was based on the methods originally used in its development. This version of the n-back task requires the participant to repeat the nth item back (e.g. 0-back, 1-back and 2-back) in a sequentially presented list of items (Dobbs and Rule, 1989). We used this same technique in our recent dual-task study with advanced Parkinson’s disease patients during unilateral and bilateral subthalamic nucleus DBS (Alberts et al., 2008). The difficulty level of the n-back task is manipulated by requiring the participants to remember items further back in the list. The type of n-back test used in this study used a list of random letters presented to the participant. The number of intervening letters varied from 0 to 2. This method of n-back testing requires encoding, maintenance, updating and output. However, unlike other versions of the task, it does not require comparison or decision-making.
Two English-speaking experimenters administered the n-back task. Experimenter 1 read aloud the randomized letter sets of the n-back task while experimenter 2 monitored the participant’s responses for accuracy. Participants were asked to respond by articulating the letter presented directly before (0-back), 1 cycle before (1-back) or two cycles before (2-back). If the participant provided an incorrect response or was unable to answer correctly within the allotted time (1.5 s), the trial would begin with a new sequence of letters. Approximately 19–23 trials (letters) were presented during a 30 s block. After performing the n-back task for 30 s, participants rested for 15–45 s and then repeated the n-back task under the same level of difficulty (0-, 1- or 2-back). Participants performed five 30 s blocks at each n-back condition (0-, 1- and 2-back). These five blocks were collected sequentially and randomized across participants. To account for practice effects, all participants completed three practice trials (30 s each) at each n-back level prior to data collection. Three trials have been shown to be sufficient to ensure task comprehension and stable performance for advanced Parkinson’s disease patients (Alberts et al., 2008); all participants in this study reported task comprehension and demonstrated stable performance. All practice and test blocks consisted of a unique list of randomized letters to prevent any memorization of letters.
Force-maintenance task
Participants used a precision grip (i.e. thumb and index finger only) of their dominant hand to exert an isometric force against the force transducer. The participant’s dominant hand was determined using the Edinburg Handedness Inventory (Oldfield, 1971). The force transducer was oriented in a comfortable position to the patient and affixed to the table to prevent any movement and for consistency throughout force tracking. Three maximum precision grip efforts, 5 s each, were completed at each of the three data collection sessions. These data were used to establish the maximum grip force of the patient. Between each maximum effort, patients rested 1–2 min. The peak force achieved from the three efforts was considered the maximum and was used to calculate a target force level; 20% of the maximum force. The 20% target force level was selected as Galganski and colleagues (1993) found no differences in younger adults’ and older adults’ standard deviation at this force level; and based on our previous studies with younger adults, older adults and advanced Parkinson’s disease patients this force level could be maintained relatively easily with minimal fatigue (Voelcker-Rehage and Alberts, 2006, 2007; Alberts et al., 2008). The target force level produced and actual real-time grip force produced by the participant was displayed on a 21″ LCD monitor located 44–59 cm directly in front of the participant. Participants were instructed to match their grip force to the target force line as accurately as possible. Participants performed one to five practice repetitions prior to test blocks to be certain all task requirements were understood. Ten force-maintenance blocks for each limb, 30 s each, were performed with at least 30 s of rest between each block.
Dual task: n-back and force maintenance simultaneously
Participants performed 15 dual-task blocks in which they were asked to perform the n-back task and force maintenance task simultaneously. The force maintenance task was performed in random combination with each of the three n-back conditions (0-back, 1-back and 2-back; five repetitions each). Participants were instructed to perform both tasks as accurately as possible and to devote half of their attention to the cognitive task and half of their attention to the motor task. Participants were given at least 30 s of rest between each block.
Selection of model DBS parameters
For each subject enrolled in the study, we created a patient-specific DBS computer model of each side of the patient’s brain using Cicerone v1.2, a freely available academic DBS research tool (Miocinovic et al., 2007) (Fig. 1). The models were created by AMN and CCM without any a priori knowledge of the patient, aside from access to their clinical preoperative MRI and CT imaging, surgical targeting and intraoperative microelectrode recording data. AMN and CCM were blinded to each patient’s clinical symptoms, drug regiment, clinical DBS programming notes and Clinical stimulation parameter settings.
Each patient-specific DBS model included coupled integration of MRI/CT data, microelectrode recording data, 3D brain atlas surfaces, DBS electrodes and volume of tissue activated predictions all coregistered into the neurosurgical stereotactic coordinate system following our previously described methodology (Fig. 1) (Butson et al., 2007b; Miocinovic et al., 2007; Maks et al., 2009). The first phase of model development was to import the imaging data into the software. The stereotactic coordinate system was defined by identifying fiducial landmarks of the neurosurgical head frame used to implant the electrode (Fig. 1A). The CT or MRI acquired with the frame in place was called the frame image, and any subsequent imaging data used in the model were coregistered to the frame image. Coregistration between the frame image and an alternative image was performed manually within Cicerone using a two-step process. First, coordinates of the anterior and posterior commissures, defined by the operating neurosurgeon, were used initially to register the two images together. Second, a nine panel graphical user interface allowed for manual manipulation to fine tune the image fusion. This graphical user interface displayed the axial, coronal and sagittal views of the frame image on the left column, the alternative image on the right column and an overlay of the two in the middle column. The images were from the same individual; therefore, a rigid body transformation could be performed to bring the images into near perfect alignment.
The second phase of model development consisted of entering the stereotactic location of each microelectrode recording data point, colour coded based on its neurophysiologically defined nucleus, into the model (Fig. 1B and C). 3D anatomical representations of the various nuclei of interest (thalamus and subthalamic nucleus) were then scaled and positioned within the context of the preoperative MRI and microelectrode recording data (Fig. 1B and C). This process was performed manually, taking into account both anatomical structures visible in the MRI and fitting microelectrode recording points within their respective nuclei to provide the best possible overall fit of the brain atlas to the patient (Lujan et al., 2009; Maks et al., 2009). Once the patient’s anatomical model was defined, the electrode type (Medtronic Electrode Model 3387 or 3389) was selected, and the implantation position of the DBS electrode, as defined intraoperatively by stereotactic coordinates, was displayed within the model system (Fig. 1D). Post hoc comparison with the postoperative CT verified that the intended surgical placement of the DBS electrode was within the artifact of the imaged electrode.
Based on our previous experience developing patient-specific models of therapeutic subthalamic nucleus DBS (Butson et al., 2007a; Maks et al., 2009), we defined a theoretical ellipsoid target volume (Fig. 1E). Stimulation of this target area, which included the dorsal subthalamic nucleus and white matter dorsal to the subthalamic nucleus, has been associated with excellent clinical outcomes in our previous work. We defined a stimulation parameter setting for each side of each patient’s brain that maximized stimulation coverage of the target volume and minimized stimulation spread outside of the target volume. This theoretically optimal parameter setting was called the ‘Model deep brain stimulation’, and it was defined using theoretical predictions of the volume of tissue activated (Fig. 2). The volume of tissue activated provides an electrical prediction of the volume of axonal tissue directly activated by DBS for a given stimulation parameter setting. The volumes of tissue activated used in Cicerone v1.2 are precompiled solutions from the DBS models previously described by our group (Butson et al., 2006). The software provided the ability to quickly and interactively evaluate a wide range of stimulation parameter settings and enable definition of a theoretically optimal Model DBS for each side of each patient (Table 2).
Figure 2.

Representative volume of tissue activated for the right and left stimulators during Clinical and model DBS settings. Data presented for Patient 1. (A) Right side model settings: contact 2, 2.0 V, 0.06 ms, 130 Hz. (B) Left side Model settings: contact 3, 1.8 V, 0.06 ms, 130 Hz. (C) Right side clinical settings: contact 2–3+, 4.0 V, 0.06 ms, 130 Hz. (D) Left side clinical settings: contact 2, 3.2 V, 0.06 ms, 130 Hz.
Following completion of the clinical study, we quantified the volumes of tissue activated for each patient under both the Model and Clinical settings, along with their respective overlap with the subthalamic nucleus atlas volume. Each subthalamic nucleus volume, as fitted to each hemisphere of each patient, was divided into a ventral and dorsal section. The subthalamic nucleus division was defined by a plane parallel to the anterior–posterior commissures plane that cut through the centriod of the subthalamic nucleus. Table 3 contains the total volume of tissue activated for each DBS condition and the volume of tissue activated within the ventral and dorsal portions of the subthalamic nucleus.
Table 3.
Volume of tissue activated during Model and Clinical DBS
| Patient | Side | Clinical—volume of tissue activated (mm3) |
Model—volume of tissue activated (mm3) |
||||
|---|---|---|---|---|---|---|---|
| Total | Inside dorsal STN | Inside ventral STN | Total | Inside dorsal STN | Inside ventral STN | ||
| 1 | Left | 116.6 | 47.4 | 18.9 | 45 | 13.8 | 0 |
| 1 | Right | 39 | 23.9 | 0 | 55.1 | 36.2 | 0.5 |
| 2 | Left | 108.9 | 31 | 0.6 | 71.7 | 20.3 | 0 |
| 2 | Right | 124.9 | 34.8 | 36.2 | 57.2 | 6.8 | 0 |
| 3 | Left | 29.1 | 12.3 | 0 | 65.4 | 28.2 | 2.3 |
| 3 | Right | 39.6 | 10.7 | 8.7 | 76.3 | 24.3 | 0.4 |
| 4 | Left | 29.8 | 15 | 0 | 49.6 | 25.7 | 0.3 |
| 4 | Right | 44.9 | 22.4 | 12.4 | 83.8 | 46.2 | 3.7 |
| 5 | Left | 33.6 | 19.5 | 0.2 | 76.4 | 38.9 | 6.4 |
| 5 | Right | 37.4 | 20.5 | 0 | 84.1 | 45.2 | 2.4 |
| 6 | Left | 96.9 | 32.3 | 0 | 68.4 | 22.1 | 0 |
| 6 | Right | 106.3 | 37.2 | 2.3 | 73.7 | 27.4 | 0.4 |
| 7 | Left | 45.3 | 4.2 | 6.3 | 68.9 | 13 | 0 |
| 7 | Right | 137.2 | 35.7 | 35.7 | 35.4 | 25.3 | 3.3 |
| 8 | Left | 129.1 | 28.2 | 28.5 | 68.2 | 17.5 | 0 |
| 8 | Right | 103.7 | 41.3 | 9.5 | 49.5 | 25.5 | 1.7 |
| 9 | Left | 199.9 | 78.8 | 33 | 47.4 | 12 | 0 |
| 9 | Right | 199.9 | 68.6 | 43.6 | 65.5 | 25.8 | 0 |
| 10 | Left | 106.3 | 39.5 | 37.7 | 64.5 | 21 | 0 |
| 10 | Right | 96.3 | 25.4 | 0 | 52.9 | 13 | 0 |
| Mean | 91.2 | 31.4 | 13.7 | 63.0 | 24.4 | 1.1 | |
| SD | 53.0 | 18.3 | 15.9 | 13.4 | 10.8 | 1.7 | |
STN = subthalamic nucleus.
Calculation of power requirements for stimulation parameters
Waveforms were simulated according to the specific output of the Medtronic implanted pulse generator (Butson and McIntyre, 2007). The power of stimulation with a given frequency, pulse width and amplitude was calculated by averaging the instantaneous power over a 1 s period.
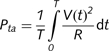 |
where Pta is the time-averaged power, T is set to 1 s, V(t) is the instantaneous voltage, R input resistance and t time. The power consumption, in microwatts, was calculated for both the Clinical and Model DBS settings.
Procedure
All data were collected during two visits to our research laboratory at the Cleveland Clinic. These two data collection sessions were separated by at least 72 h. For both sessions, participants reported to the laboratory in the clinically defined OFF condition (i.e. at least 12 h since their last dose of antiparkinsonian medication) whilst ON DBS with their clinically defined stimulation parameters. After completing the informed consent process, patients were evaluated clinically with the Unified Parkinson’s Disease Rating Scale (UPDRS) Part-III Motor Exam administered by an experienced movement disorders neurologist, the same neurologist completed all ratings except for one experimental session (Pt. 9; Clinical settings).
Each participant completed evaluation and testing under three DBS conditions: Off, Clinical and Model across the two laboratory visits. The order of testing Clinical and Model DBS parameters was randomized across patients in the two laboratory visits. For example, Day 1 testing consisted of completing all tests while on Clinical deep brain stimulation, and then, following completion, the patient’s stimulator was turned Off for 3 h and all clinical, motor, cognitive and cognitive–motor testing was repeated. On Day 2, the patient would complete all testing using the Model DBS parameters. Five patients were tested under Clinical DBS on Day 1 and five patients completed Model DBS on Day 1. Within each experimental session, the single-task conditions were completed before the dual-task conditions. The single-task conditions were the n-back task (three levels of difficulty: 0-, 1- and 2-back) and force maintenance task only. The order of completing the single-task cognitive and motor tasks was randomized across patients. The order of dual-task conditions, force maintenance with the three different levels of n-back, was randomized across patients.
The Clinical and Off DBS experimental session patients completed all testing on two occasions within the same day: first under Clinical DBS parameters and then while Off. After completing all clinical, cognitive, motor and cognitive–motor tests under Clinical deep brain stimulation, the patient’s stimulators were turned Off for 3 h to allow the effects to wear off (Temperli et al., 2003; Alberts et al., 2004, 2008). During this 3 h wash-out period, the patient remained in the laboratory and was provided lunch and rest. Following the 3 h wash-out period, the patient repeated all clinical, cognitive, motor and cognitive–motor tests. Upon completion of this experimental session, the patient’s stimulators were turned on (Clinical DBS parameters were restored), and they resumed their antiparkinsonian medication. Approximately 30 min after taking their medication and restoration of deep brain stimulation, the patient departed the laboratory. The total time spent in the laboratory during a Clinical and Off DBS experimental session was ∼5–6 h (∼2 h of data collection and 3 h rest during the wash-out period).
The Model DBS experimental session, which randomly occurred on Days 1 or 2, was completed in ∼4–5 h. For the Model DBS session, the patients arrived in the laboratory OFF antiparkinsonian medication and ON Clinical deep brain stimulation. Upon arrival, both stimulators were turned Off. The patient then rested in the laboratory for the next 2 h. After 2 h, the patient was reprogrammed using the Model DBS parameters. After 60 min under Model DBS parameters, the patient completed all clinical, cognitive, motor and cognitive–motor testing. Upon completion of the Model DBS testing session, the patient’s stimulators were reprogrammed to their clinically defined parameters, and they took their antiparkinsonian medication and departed the lab ∼30 min later.
Data analysis
Force maintenance
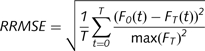
All force data were filtered with a phase-symmetric low-pass filter using Woltring’s algorithm (Voelcker-Rehage et al., 2006; Voelcker-Rehage and Alberts, 2007) using existing MATLAB analysis programs developed in our laboratory. Force data were assessed for accuracy from 3 s after the start of the block until completion of the block; this period allowed the patient sufficient time to achieve the target force. The primary motor outcome variables for the force-tracking task were time within the target range (TWR) and relative root mean square error (RRMSE). The TWR is calculated by determining the time the patient’s force trace is within ± 2.5% of the target line. The TWR provides an overall accuracy measure of force tracking. To account for differences in the amplitude of the target force (e.g. interpatient and intrapatient variability due to stimulation status), the RRMSE, as defined in the equation below, was used as a method of normalizing performance relative to force amplitude. The RRMSE is considered to reflect the overall variability of force-tracking performance; a lower RRMSE suggests control of distal musculature and hand functionality (Kriz et al., 1995; Kurillo et al., 2004). In the equation below, FT(t) is the target force provided to the patient, F0(t) is the force produced by the patient and T is the time of the block.
 |
n-Back performance
n-Back performance was measured by determining the percentage of correct letters recalled during a 30 s block and the total number of errors committed during a block (Voelcker-Rehage et al., 2006).
Dual-task analysis
To examine participants’ performance under the dual-task conditions, the dual task loss (DTL) was computed using a standard measure to compare performance on single and dual-task conditions (Lindenberger et al., 2000). The DTLs were computed as the percentage of loss in motor and cognitive performance during dual-task conditions relative to performance in the single-task conditions in the following manner:
Statistical analysis
Paired sample t-tests were used to examine differences between the DBS conditions for clinical ratings (UPDRS-III), power consumption and volume of tissue activated location. Motor (RRMSE, TWR) and cognitive (percentage of correctly repeated letters and the total number of errors) performance data were analysed with within-subjects ANOVAs. Greenhouse Geyser adjustment was reported when the sphericity assumption was violated. Post hoc contrasts (Bonferroni adjustment) were used to determine differences between the DBS status, and level of task difficulty to determine the conditions that were most affected by the different DBS parameter settings. Analyses were conducted separately for the motor and cognitive task.
Two 3 (DBS condition: Off, Clinical, Model) × 3 (task difficulty: 0-, 1- and 2-back) × 2 (context: single-task, dual-task) repeated measure ANOVAs were used to determine differences between different DBS parameter setting in n-back difficulty and between single- and dual-task context using the percentage of correctly repeated letters and the total number of errors. Additionally, two 3 (DBS condition) × 4 (task difficulty: force only, force at 0-, 1- and 2-back difficulty) within-subjects ANOVAs were carried out using the RRMSE and TWR scores.
To examine whether DTLs for the force maintenance task and the n-back difficulties were significantly different from zero, a series of one-sample t tests (test value = 0) were conducted separately for each DBS condition. Within-subjects ANOVAS with corresponding post hoc tests (Bonferroni adjustment) were used to compare the DTLs for task difficulties (0-, 1- and 2-back) and DBS status.
Multiple testing increases the risk of chance findings due to potential alpha error accumulation (type I or experiment-wise error). To control for type I error, post hoc comparisons of the nominal alpha level were adjusted for the three DBS conditions or comparisons (Off, Clinical and Model) using Bonferroni adjustments: [α = 1 − (1 − α)1/m], with m = number of single comparisons and α = nominal α-level). Experimental P values and Bonferroni adjusted α-levels are reported.
Results
Clinical ratings
Table 1 contains UPDRS-III Motor scores for each patient during Off, Clinical and Model deep brain stimulation. For all patients, the UPDRS-III scores decreased with Clinical and Model DBS compared with Off deep brain stimulation. Clinical deep brain stimulation, on average, resulted in a 46% improvement in UPDRS-III ratings (range, 37–58%) while Model DBS also improved clinical ratings by 46% (range, 38–59%). Statistical analysis (t-tests for paired samples) revealed that UPDRS-III scores for Clinical and Model DBS were significantly better than Off [tcli-off (9) = 3.90, P = 0.004; tmod-off (9) = 3.30, P = 0.009)]. Also, after adjustment of the nominal α-level (adjusted α = 0.017), results remained significant. However, there was no statistical difference in UPDRS-III scores between Clinical and Model DBS settings [t(9) = 0.23, P = 0.820].
Location of volume of tissue activated
The total volume of tissue activated and volume of tissue activated within the dorsal and ventral portions of the subthalamic nucleus are provided in Table 3. The total volume of tissue activated with Clinical and Model settings was not significantly different from one another nor was the volume of tissue activated within the dorsal portion of the subthalamic nucleus. However, under Clinical parameters, the volume of tissue activated within the ventral portion of the subthalamic nucleus was significantly greater compared with ventral volume of tissue activated under Model parameters [tmod-cli(9) = −3.20, P = 0.011] and remained significant after adjustment of the nominal α-level (adjusted α = 0.017).
DBS power consumption
The power consumption associated with Clinical and Model parameters for each stimulator and the total amount of power, in microwatts, is provided in Table 4. In terms of total power consumption, the Model parameters consume ∼50% less microwatts than Clinical parameters [tmod-cli (9) = 8.45, P < 0.001]. For all 10 patients, total power consumption was less with Model compared with Clinical parameters and power consumption was less with Model compared with Clinical parameters for both the right [tmod-cli (9) = 4.21, P = 0.002] and left stimulators [tmod-cli (9) = 6.6, P < 0.001]. These differences in power consumption between Clinical and Model parameters remained significant after adjustment of the nominal α-level.
Table 4.
Power consumption, in microwatts, for Clinical and Model stimulation parameters
| Patient | Clinical |
Model |
Total |
|||
|---|---|---|---|---|---|---|
| Left | Right | Left | Right | Clinical | Model | |
| Power (µW) | ||||||
| 1 | 122.65 | 191.63 | 25.67 | 31.69 | 314.28 | 57.36 |
| 2 | 174.53 | 146.13 | 53.56 | 38.35 | 320.66 | 91.91 |
| 3 | 100.79 | 100.79 | 41.91 | 53.56 | 201.58 | 95.47 |
| 4 | 106.63 | 89.60 | 25.67 | 62.12 | 196.24 | 87.79 |
| 5 | 161.19 | 189.18 | 53.56 | 62.12 | 350.37 | 115.68 |
| 6 | 71.31 | 81.13 | 45.64 | 53.56 | 152.44 | 99.20 |
| 7 | 220.89 | 220.89 | 49.52 | 17.83 | 441.79 | 67.35 |
| 8 | 127.36 | 84.25 | 25.67 | 45.64 | 211.62 | 71.31 |
| 9 | 66.63 | 66.63 | 25.67 | 45.64 | 133.27 | 71.31 |
| 10 | 115.46 | 115.46 | 45.64 | 31.69 | 230.92 | 77.33 |
| Mean | 126.75 | 128.57 | 39.25 | 44.22 | 255.32 | 83.47 |
| SD | 47.43 | 54.77 | 12.21 | 14.39 | 97.70 | 17.62 |
Cognitive functioning and DBS during single and dual-task conditions
Percentage of correct letters
The results from the repeated measures ANOVA (Fig. 3) revealed that overall n-back performance decreased with increasing task difficulty [F(2,18) = 48.422, P < 0.001, η2 = 0.843]. The main effects of DBS status [F(2,18) = 2.010, P = 0.163] did not achieve statistical significance while the main effect of context [F(2,18) = 4.879, P = 0.055] approached statistical significance. The task difficulty × DBS condition interaction, however, was significant [F(4,18) = 2.945, P = 0.033, η2 = 0.247], resulting from a greater performance decrease with increasing n-back difficulty for Clinical DBS than for Off and Model. Performance on the 2-back during Clinical DBS was significantly lower than performance at Off in single-task conditions (t = 2.62, P = 0.028; adjusted α = 0.017).
Figure 3.

Working memory performance, percent of letters correctly repeated during single- and dual-task conditions. (A) Results of the n-back task in the single-task condition at Off DBS, Clinical DBS and Model DBS (means and standard errors). (B) Results of the n-back task in the dual-task condition at Off DBS, Clinical DBS and Model DBS (means and standard errors). A cross marks a significant differences between Off and Clinical DBS and a double asterisk marks a significant difference between Clinical and Model DBS.
Number of errors
Errors in cognitive function were primarily due to responding with the incorrect letter and the participant reporting to experimenter that they did not remember the letter to be recalled. Less than 0.5% of the errors were the result of the patient not responding within the ∼1.5-s time period. For the number of errors, the effect of task difficulty [F(2,18) = 50.381, P < 0.001, η2 = 0.848] and the task difficulty by context interaction [F(2,18) = 3.859, P = 0.040, η2 = 0.300] were significant. Participants produced more errors as the difficulty of the n-back task increased.
Motor function and DBS during single and dual-task conditions
Representative force-tracking data for an entire set, from one patient, for all three DBS conditions during single and dual-task settings are presented in Fig. 4. When performing the force-tracking task only (left plots), Clinical and Model DBS resulted in better tracking performance compared with Off. Although patients were Off, force-tracking performance became slightly more variable as the difficulty of the dual-task increased. During Clinical deep brain stimulation (Fig. 4 middle plots) force-tracking performance declined dramatically as task difficulty increased, in particular, during the 2-back condition in which variability was greatest. The lower panels in Fig. 4 depict force-tracking trials during Model deep brain stimulation. In general, the consistency of force tracking during Model DBS was relatively unaffected as the difficulty of the task increased under dual-task conditions. The TWR and RRMSE measures were used to quantify force-tracking performance.
Figure 4.

Representative force-tracking trials (Patient 1) during Single and all Dual-task conditions (right columns) under the three DBS settings: Off (upper plots), Clinical DBS (middle plots) and Model DBS (lower plots). The horizontal line represents the target force line the patient was instructed to match.
Time within target range
When completing the force-maintenance task only, Clinical and Model DBS conditions were significantly better than the Off condition (tcli-off = −3.30, P = 0.009; tmod-off = −4,12, P = 0.003; adjusted α = 0.017). As expected, motor performance tended to decrease (lower TWR) as patients moved from the single to dual-task conditions (Fig. 5A). There was a significant main effect of task difficulty [F(327) = 18.511, P < 0.001, η2 = 0.673]. However, the rate of decline in motor performance differed across stimulation conditions [F(2,18) = 12.229, P < 0.001, η2 = 0.576]. With Clinical deep brain stimulation, the rate of motor performance decline was greater compared with the decline under Model settings. A significant interaction between DBS condition and task difficulty was present [F(6,54) = 4.857, P < 0.001, η2 = 0.351]. During Off and Model DBS conditions, the slope of decline in motor performance was similar across dual-task conditions. However, under Clinical DBS settings, TWR decreased dramatically across all task difficulties. Furthermore, Model DBS led to significantly better force-tracking performance when compared with Clinical or Off in all dual-task conditions (0-back: tmod-off = 2.86, P = 0.019; tmod-cli = 3,92; P = 0.004; 1-back: tmod-off = 3.85, P = 0.004; tmod-cli = 3.53, P = 0.006; 2-back: tmod-off = 3.29, P = 0.009; tmod-cli = 4.72, P = 0.001; adjusted α = 0.017).
Figure 5.

Force-tracking (FT) performance across stimulation conditions. (A) Results of the TWR force in the single and dual-task conditions at Off DBS, Clinical DBS and Model DBS (means and standard errors). (B) Results of the RRMSE force in the single and dual-task conditions at Off DBS, Clinical DBS and Model DBS (mod DBS) (means and standard errors). A cross marks a significant differences between Off and Clinical DBS, an asterisk marks a significant difference between Off and Model DBS, and a double asterisk marks a significant difference between Clinical and Model DBS.
Relative root mean square error
In general, the variability in force tracking increased significantly as task difficulty increased, moving from single to dual-task conditions [F(1.35,27.73) = 10.113, P = 0.005, η2 = 0.529]. Additionally, the force variability differed between the three DBS conditions [F(2,54) = 5.042, P = 0.018, η2 = 0.359], under Clinical DBS variability was the greatest. As shown in Fig. 5B Clinical DBS resulted in more variable force production across dual-task conditions; as task difficulty increased to the 2-back condition, force variability was significantly greater compared with Model DBS (1-back: tcli-mod = 2.59, P = 0.029; 2-back: tcli-mod = 2.53, P = 0.032). After adjustment of the nominal α-level, results were only marginally significant (adjusted α = 0.034).
Dual-task losses different from zero
The DTLs for n-back performance at the 0-back condition were relatively small and nonsignificant across the three DBS testing conditions (Fig. 6). Declines in n-back performance were greater when moving from the single task 1-back condition to the dual-task 1-back condition, in particular, for the Off [t1-back (9) = 2.224, P = 0.053] and Model conditions [t1-back (9) = 2.059, P = 0.070] (due to the fact that under single-task conditions n-back performance was relatively high). After adjustment of the nominal α-level (α = 0.017), results were no longer significant. The DTLs associated with Clinical DBS were not significant.
Figure 6.

Dual-task losses (DTLs) and standard errors for (A) the force maintenance task (TWR), and (B) RRMSE at Off DBS, Clinical DBS (cli DBS) and Model DBS (mod DBS). An asterisk signifies DTLs significantly >0 and significant differences between the states of stimulation (*P < 0.05).
As expected, ‘force-tracking’ performance did decline as task complexity increased from single to dual-task conditions while Off DBS and under Clinical and Model DBS settings. However, the declines in force tracking (Fig. 6a and b) were greatest during Clinical DBS settings. For TWR, the greatest declines in motor performance when moving from a single to dual-task were associated with Clinical DBS [Clinical: t0-back (9) = 3.091, P = 0.013; t1-back (9) = 3.058, P = 0.014; t2-back (9) = 7.151, P < 0.001; Model: t0-back (9) = 0.537, P = 0.604; t1-back (9) = 0.771, P = 0.460; t2-back (9) = 2.363, P = 0.042; Off: t0-back (9) = −1.542, P = 0.157; t1-back (9) = 0.269, P = 0.794; t2-back (9) = 2.026, P = 0.073]. After adjustment of the nominal α-level (α = 0.017), results for Clinical DBS remained significant. The greatest performance decrements for each DBS condition occurred during the most complex testing condition, 2-back + force maintenance and the smallest decrement during the simplest, 0-back + force maintenance (Fig. 6A). A similar pattern of results was present when examining the variability of force production (RRMSE): the greatest declines in motor performance were associated with Clinical DBS [t0-back (9) = −1.674, P = 0.128; t1-back (9) = −2.636, P = 0.027; t2-back (9) = −2.970, P = 0.016]. Result of 2-back remained significant after adjustment of the nominal α-level (adjusted α = 0.017). The DTLs in force-tracking performance (RRMSE) at Off DBS were significant [also after adjustment of the nominal α-level (α = 0.017)] for all n-back conditions [t0-back (9) = −3.767, P = 0.004; t1-back (9) = −5.023, P = 0.001; t2-back (9) = −4.131, P = 0.003], whereas under Model deep brain stimulation, DTLs were not significant [t0-back(9) = −2.014, P = 0.075; t1-back (9) = −2.005, P = 0.076; t2-back (9) = −1.924, P = 0.087].
Task difficulty and stimulation differences in dual task losses
The DTLsn-back, in general, increased significantly as task difficulty also increased [F(2,18) = 3.831, P = 0.041, η2 = 0.299]. However, the DTLsn-back were not differentially affected across stimulation conditions (Off, Clinical or Model) [F(2,18) = 0.425, P = 0.660].
For the DTLsforce, a significant main effect of task difficulty for TWR was present [F(2,18) = 26.984, P < 0.001, η2 = 0.750]. As task difficulty increased, DTLs in force maintenance also increased as shown in Fig. 6a. The loss in motor performance was relatively small for the 0-back condition while relatively large for the 2-back dual-task condition. A significant main effect of stimulation [F(2, 18) = 5.940, P = 0.010, η2 = 0.398] was present. Differences between DBS states were mostly significant in the 0-, 1- and 2-back conditions with higher DTLs with Clinical DBS compared with Off and Model (0-back: tcli-off = 3.72, P = 0.005; tcli-mod = 2.14, P = 0.061; 1-back: tcli-off = 1,98; Pcli-off = 0.079; tcli-mod = 2.92, P = 0.017, 2-back: tcli-off = 2.77, P = 0.022; tcli-mod = 4.18, P = 0.002; adjusted α = 0.017). The DTLs in terms of the variability (RRMSE) of force production were similar to TWR as losses in performance were greater during Clinical compared with Off and Model DBS conditions (Fig. 6B).
Discussion
Recently, we have shown that bilateral subthalamic nucleus DBS does indeed disrupt Parkinson’s disease patients’ cognitive–motor functioning under dual-task conditions (Alberts et al., 2008). In this project, we sought to minimize these DBS related declines in cognitive–motor functioning through the use of patient-specific DBS models that account for electrode location and the volume of tissue activated. The primary criterion for the selection of Model DBS parameters was maximized stimulation coverage of a target volume that included the dorsal subthalamic nucleus and white matter dorsal to the subthalamic nucleus, thus minimizing stimulation of nonmotor regions of the subthalamic nucleus. The primary aim of this project was to compare two methods of DBS programming, the typical clinical method and our computational approach on cognitive–motor performance in patients with advanced Parkinson’s disease. Clinical assessments indicated that both methods of DBS programming were effective in improving UPDRS-III scores. However, under all dual-task conditions, motor performance was, in general, better with Model determined stimulation parameters compared with Clinical settings. In addition, cognitive performance (working memory) was better during modestly complex-task conditions, using Model compared with Clinical settings. Overall, these data suggest that cognitive–motor declines are not uncommon during bilateral subthalamic nucleus deep brain stimulation, but can be mitigated through the use of software that depicts the volume of tissue activated associated with a given parameter setting relative to the targeted brain structure.
Clinical and Model DBS during single-task conditions
One of the goals of DBS is to alter pathological neural activity within the basal ganglia thalamocortical circuit to provide maximum motor response with minimal side effects. As expected, there were no overt side effects detected during routine clinical evaluations with any of the Clinical parameters. During programming of the Model DBS settings, one patient (Patient 3) reported a persistent paraesthesia in their right leg as the voltage of the left stimulator was increased during the reprogramming session. As a result, the voltage was reduced to a level in which the tingling sensation subsided. For this patient, the Model had recommended 3 V, however, the patient was programmed using 2.3 V and completed all Model testing with this voltage. No other side effects were reported by any other patient during the setting of the Model parameters. Clinical and Model stimulation parameters were both equally effective in improving the motor response as measured by the UPDRS-III. The average improvement in OFF-medication UPDRS-III scores for both parameter settings, 46%, is within the range of improvement typically reported in long-term studies with bilateral subthalamic nucleus DBS in advanced Parkinson’s disease patients (Kumar et al., 2003; Abelson et al., 2005; Rodriguez-Oroz et al., 2005; Weaver et al., 2009). Both Model and Clinical DBS resulted in ∼25% improvement in the force-maintenance task during single-task conditions compared with Off. Similar improvements in clinical ratings and distal force control using different DBS parameters, in which the volume of tissue activated encompassed various portions of the dorsolateral sensorimotor portion of the subthalamic nucleus and adjacent areas, suggest there may be no ‘single set’ of stimulation parameters that is optimal for improving motor symptoms and performance.
Similar to our previous study (Alberts et al., 2008), working memory, during single-task conditions, declined for all three stimulation conditions as task difficulty increased from the 0-back to the 1- and 2-back conditions. Although the differences in working memory between Model and Clinical parameter settings during the 2-back were not statistically significant, there was a trend toward significance as performance was worse with Clinical settings. Declines in working memory associated with bilateral subthalamic nucleus deep brain stimulation, especially when the difficulty of the task was increased, are consistent with the work by Hershey and colleagues (2004). They reported that when memory demands of a task were increased, Parkinson’s disease patients with bilateral subthalamic nucleus DBS exhibited deficits in working memory (Hershey et al., 2004). Our previous data indicated that unilateral subthalamic nucleus DBS had little effect on working memory as n-back performance was similar during unilateral stimulation to that when patients were off DBS (Alberts et al., 2008). In this study, n-back performance at the most difficult condition (2-back) was compromised to a greater degree under Clinical than under Model or when Off deep brain stimulation. These data suggest that minimizing current spread to the nonmotor regions of the subthalamic nucleus and/or adjacent white matter may alleviate some of the declines in working memory that may be associated with bilateral subthalamic nucleus deep brain stimulation. Although the use of Model parameters did mitigate working memory declines, compared with Clinical parameters, working memory during bilateral subthalamic nucleus DBS with Model parameters was not better than performance during unilateral DBS (Alberts et al., 2008). The observation that cognitive functioning (working memory) during unilateral DBS was better than bilateral subthalamic nucleus deep brain stimulation, whether Model or Clinical based, provides a rationale for taking a more conservative approach to the common practice of initially implanting bilateral DBS systems. Collectively, our previous and current results suggest a staged DBS implantation strategy may be warranted. With a staged approach, the effects of unilateral DBS on motor, cognitive and cognitive–motor function could first be assessed before implanting the second side. This approach may decrease the likelihood of cognitive–motor declines related to bilateral subthalamic nucleus DBS and which may ultimately diminish the patients overall quality of life.
Clinical and model DBS during dual-task conditions
The transition from a single- to dual-task conditions compromised motor and cognitive performance for all patients. The greatest dual-task cost or loss in performance was observed in the motor task. Although force-tracking performance during single-task conditions was similar with Clinical and Model parameters, the introduction of a relatively simple cognitive task (0-back) under Clinical settings dramatically affected motor performance. In fact, during the force + 0- and 1-back conditions, motor performance (based on TWR) was similar while patients were under Clinical DBS parameters and while Off stimulation. At the most complex dual-task condition (force + 2-back), motor performance was actually worse with Clinical DBS compared with Off. With Model DBS settings, force-tracking performance did decline slightly when moving from the single to dual-task conditions. However, these decrements in motor performance were not significant, and motor performance was significantly better compared with Clinical and Off deep brain stimulation. Previously, we and others have hypothesized that the spread of current to nonmotor regions of the subthalamic nucleus may be responsible for the emerging cognitive declines associated with bilateral subthalamic nucleus DBS and the substantial loss in motor performance when patients perform a dual-task (Alberts et al., 2008). A post hoc inspection of the volumes of tissue activated associated with Clinical DBS parameters confirmed that current spread throughout the dorsal and ventral portions of the subthalamic nucleus (Table 3). Through our previous work, we identified an optimal target volume of tissue activated, and, through the use of model-based software, we are able to predict the volume of tissue activated for a given lead location with a given set of parameters (Butson et al., 2007a; Maks et al., 2009). In turn, we established a set of stimulation parameters that minimized the spread of current to the nonmotor portions of the subthalamic nucleus, while stimulating as much of the optimal target region as possible. Based on the current data, it appears that maximizing current spread to the dorsal area of subthalamic nucleus and adjacent areas while minimizing spread to ventral portions of the subthalamic nucleus is an important variable in the programming of DBS parameters as these criteria resulted in a reversal of the motor declines associated with bilateral subthalamic nucleus DBS during the performance of a cognitive–motor dual-task.
The transmission of pathological information within the basal ganglia thalamocortical circuits is hypothesized to underlie the symptoms of Parkinson’s disease (Albin et al., 1989; DeLong, 1990; Llinas et al., 1999; Vitek and Giroux, 2000; Timmermann et al., 2003). It has been hypothesized that DBS acts to regularize activity within the motor circuit, thereby reducing the passage of pathological information from the pallidum (Hashimoto et al., 2003; Guo et al., 2008). The spread of current to nonmotor regions of the subthalamic nucleus is likely to disrupt the spread of nonpathological information from these nonmotor regions of the subthalamic nucleus. Disruption of information processing in these nonmotor regions may be responsible for the DBS related cognitive–motor declines observed under dual-task conditions. The loss of transmitted information or information processing capabilities may not produce a deficit in cognitive function following unilateral procedures (Alberts et al., 2008) or when the patients are able to focus all of their attention on the performance of a cognitive or motor task alone, as is the case during most clinical examinations. However, as the cognitive demands of the task increase, information processing demands increase. Therefore, under bilateral subthalamic nucleus DBS with clinically determined stimulation parameters the spread of current to nonmotor regions may compromise cognitive–motor functioning. Patients may attempt to draw on cognitive resources that are now even more compromised as a result of bilateral disruption of nonmotor pathways. A post hoc analysis of the force-tracking data during dual-task conditions indicated a trend in declining performance in those patients with a larger volume of tissue activated within the ventral portion of the subthalamic nucleus. However, this trend was not statistically significant due to the relatively small number of patients sampled. We are currently conducting studies that will allow us to address directly the relationship between the volume of tissue activated within the dorsal and ventral portions of the subthalamic nucleus and cognitive–motor performance during Clinical and Model parameters in a larger group of patients during unilateral and bilateral deep brain stimulation.
From a cognitive perspective, the cost in performance when moving from single- to dual-task conditions was not statistically significant for any of the stimulation conditions. It is possible, despite the fact that patients reported attending to both tasks equally, that they may have placed greater emphasis or allocated more attentional resources to performing the working memory task compared with force tracking.
Limitations of DBS models
The patient-specific DBS models used in this study were created solely within the confines of Cicerone v1.2 in an attempt to evaluate if our current DBS software was worthy of continued development. Although the results of this study are encouraging, it should be noted that the methodology used in v1.2 has limitations. First, this version of the software relies on manual registration of imaging and brain atlas data. As a result, the accuracy of these processes is user-dependent and difficult to quantify. Fortunately, these processes can be automated, and the next public release of Cicerone will use a mutual information image registration algorithm (Viola and Wells, 1997) and an automated 3D brain atlas fitting algorithm (Lujan et al., 2009). A second limitation is the accuracy of the volume of tissue activated predictions. The underlying mechanisms of subthalamic nucleus DBS remain unclear, but our proposition is that the therapeutic effects are related to the direct activation of axonal elements within a focused anatomical target region (Fig. 1E). The neurostimulation models used in this study (Butson et al., 2006) incorporated many of the features pertinent to DBS induced axonal activation; however, more detailed representations do exist (Butson et al., 2007a; Miocinovic et al., 2006, 2009) and their application within Cicerone may become useful when a more complete understanding of the therapeutic mechanisms of DBS becomes available.
Implications for DBS programming
Activities of daily living are typically performed under modestly complex conditions and have cognitive and motor components that are performed simultaneously (Cahn-Weiner et al., 2002). Frontal and executive dysfunction in the elderly and Parkinson’s disease patients without DBS can be predictive of cognitive and motor function during activities of daily living (Cahn et al., 1998; Cahn-Weiner et al., 2002). Understanding how Parkinson’s disease and DBS impact cognitive and motor function under conditions requiring greater cognitive rigor and during the simultaneous performance of cognitive and motor tasks may provide a more accurate assessment of the effect of a set of stimulation parameters on cognitive and motor performance when patients are completing ‘real-world’ tasks. Current methods of assessing cognitive and motor function in a clinical environment may not be sufficiently demanding or sensitive enough to reveal changes in cognitive or motor performance that occur when either component of a task is increased. There is an emerging body of literature, indicating a paradox between the clinical improvements in motor functioning associated with subthalamic nucleus DBS and the patient and caregiver’s level of postoperative satisfaction (Agid et al., 2006; Schupbach et al., 2006; Schupbach and Agid, 2008). Evaluating cognitive and motor performance simultaneously during DBS programming while visualizing volumes of tissue activated associated with specific DBS parameters may mitigate this paradoxical situation; such that patient satisfaction is consistent with motor benefits.
From a clinical perspective, the results from this project, despite the relatively small sample size, are important as programming DBS devices for maximal clinical benefit, and minimal side effects can be a difficult and time-consuming process, requiring a highly trained and experienced individual to achieve desirable results (Hunka et al., 2005; Moro et al., 2006). Although guidelines exist on stimulation parameter settings that are typically effective (Rizzone et al., 2001; Moro et al., 2002; Volkmann et al., 2006), these vary from patient to patient, and it is not practical to evaluate each of the thousands of stimulation parameter combinations that are possible clinically, in order to optimize DBS in each patient. As a result, the therapeutic benefits achieved with DBS are strongly dependent on the intuitive skill and experience of the clinician performing the programming (Moro et al., 2006), and the amount of time each programmer can allocate to that patient. Traditionally, the focus of clinical programming has been on the motor response, and unless nonmotor side effects are readily apparent, they are generally not detected; particularly those that may only arise under more complex testing conditions. In turn, unintentional stimulation spread, possibly due to using a higher voltage than necessary, can occur when the stimulus amplitude at a therapeutic contact is adjusted to be just below threshold for motor side effects, related to assumption that more stimulation is better than less. However, this study indicates that Model parameters resulted in similar improvements in clinical ratings and minimized cognitive–motor declines under dual-task conditions compared with Clinical settings, while using significantly less power (Table 4). Model parameters were selected both to focus the volume of tissue activated on the target region and also be energy efficient. Previous clinical studies have found no significant benefit from using stimulation frequencies greater than 100–130 Hz (Rizzone et al., 2001; Moro et al., 2002) and from the biophysical perspective of axonal activation the most energy efficient pulse width available in the Medtronic Soletra/Kinetra DBS system is 60 µs in a monopolar configuration (Butson and McIntyre, 2007; Sahin and Tie, 2007). Therefore, the Model DBS parameters were always selected with these constraints, resulting in reduced power consumption that could help to minimize the threat of stimulation induced tissue damage and prolong battery life expectancy.
Rather than relying solely on intuition and experience, future clinical DBS programming could be augmented with visualization of electrode location and theoretical calculation of an optimal volume of tissue activated. Software technology could provide an initial starting point for the clinical programming process, thereby focusing patient testing on a select range of stimulation settings where an abbreviated version of the dual-task paradigm could be performed to evaluate cognitive and motor function simultaneously. Such a paradigm could concentrate clinical resources on maximizing clinical outcomes and minimize time-consuming searches through the DBS parameter space (contact, voltage, pulse width and frequency).
Funding
National Institutes of Health (R01 NS058706, R01 NS059736); Sigma Beta, W.H. Coulter Foundation.
Acknowledgements
Tom Foutz and Ashu Chaturvedi for assistance with the DBS model calculations.
Glossary
Abbreviations
- DBS
deep brain stimulation
- DTL
dual task loss
- RRMSE
relative root mean square error
- TWR
time within the target range
- UPDRS
Unified Parkinson's Disease Rating Scale
References
- Abelson JL, Curtis GC, Sagher O, Albucher RC, Harrigan M, Taylor SF, et al. Deep brain stimulation for refractory obsessive-compulsive disorder. Biol Psychiatry. 2005;57:510–6. doi: 10.1016/j.biopsych.2004.11.042. [DOI] [PubMed] [Google Scholar]
- Agid Y, Schupbach M, Gargiulo M, Mallet L, Houeto JL, Behar C, et al. Neurosurgery in Parkinson’s disease: the doctor is happy, the patient less so? J Neural Transm Suppl. 2006:409–14. doi: 10.1007/978-3-211-45295-0_61. [DOI] [PubMed] [Google Scholar]
- Alberts JL, Elder CM, Okun MS, Vitek JL. Comparison of pallidal and subthalamic stimulation on force control in patient’s with Parkinson’s disease. Motor Control. 2004;8:484–99. doi: 10.1123/mcj.8.4.484. [DOI] [PubMed] [Google Scholar]
- Alberts JL, Voelcker-Rehage C, Hallahan K, Vitek M, Bamzai R, Vitek JL. Bilateral subthalamic stimulation impairs cognitive-motor performance in Parkinson’s disease patients. Brain. 2008;131:3348–60. doi: 10.1093/brain/awn238. [DOI] [PMC free article] [PubMed] [Google Scholar]
- Albin RL, Young AB, Penney JB. The functional anatomy of basal ganglia disorders. Trends Neurosci. 1989;12:366–75. doi: 10.1016/0166-2236(89)90074-x. [DOI] [PubMed] [Google Scholar]
- Asanuma K, Tang C, Ma Y, Dhawan V, Mattis P, Edwards C, et al. Network modulation in the treatment of Parkinson’s disease. Brain. 2006;129:2667–78. doi: 10.1093/brain/awl162. [DOI] [PMC free article] [PubMed] [Google Scholar]
- Butson CR, Cooper SE, Henderson JM, McIntyre CC. Patient-specific analysis of the volume of tissue activated during deep brain stimulation. Neuroimage. 2007a;34:661–70. doi: 10.1016/j.neuroimage.2006.09.034. [DOI] [PMC free article] [PubMed] [Google Scholar]
- Butson CR, Maks CB, McIntyre CC. Sources and effects of electrode impedance during deep brain stimulation. Clin Neurophysiol. 2006;117:447–54. doi: 10.1016/j.clinph.2005.10.007. [DOI] [PMC free article] [PubMed] [Google Scholar]
- Butson CR, McIntyre CC. Differences among implanted pulse generator waveforms cause variations in the neural response to deep brain stimulation. Clin Neurophysiol. 2007;118:1889–94. doi: 10.1016/j.clinph.2007.05.061. [DOI] [PMC free article] [PubMed] [Google Scholar]
- Butson CR, Noecker AM, Maks CB, McIntyre CC. StimExplorer: deep brain stimulation parameter selection software system. Acta Neurochir Suppl. 2007b;97:569–74. doi: 10.1007/978-3-211-33081-4_66. [DOI] [PubMed] [Google Scholar]
- Cahn DA, Sullivan EV, Shear PK, Pfefferbaum A, Heit G, Silverberg G. Differential contributions of cognitive and motor component processes to physical and instrumental activities of daily living in Parkinson’s disease. Arch Clin Neuropsychol. 1998;13:575–83. [PubMed] [Google Scholar]
- Cahn-Weiner DA, Boyle PA, Malloy PF. Tests of executive function predict instrumental activities of daily living in community-dwelling older individuals. Appl Neuropsychol. 2002;9:187–91. doi: 10.1207/S15324826AN0903_8. [DOI] [PubMed] [Google Scholar]
- Contarino MF, Daniele A, Sibilia AH, Romito LM, Bentivoglio AR, Gainotti G, et al. Cognitive outcome 5 years after bilateral chronic stimulation of subthalamic nucleus in patients with Parkinson’s disease. J Neurol Neurosurg Psychiatry. 2007;78:248–52. doi: 10.1136/jnnp.2005.086660. [DOI] [PMC free article] [PubMed] [Google Scholar]
- DeLong MR. Primate models of movement disorders of basal ganglia origin. Trends Neurosci. 1990;13:281–5. doi: 10.1016/0166-2236(90)90110-v. [DOI] [PubMed] [Google Scholar]
- Dobbs AR, Rule BG. Adult age differences in working memory. Psychol Aging. 1989;4:500–3. doi: 10.1037//0882-7974.4.4.500. [DOI] [PubMed] [Google Scholar]
- Duff-Canning SJ, Poon YY, Chang T, Mailis N, Lozano AM, Hodaie M, et al. In: 12th International Congress of Parkinson's; disease and Movement Disorders. Vol. 23. Chicago, IL: Wiley-Blackwell; He said, she said: differences between self and caregiver ratings of postoperative behavioral changes in Parkinson’s disease patients undergoing bilateral subthalamic nucleus deep brain stimulation; p. S127. [Google Scholar]
- Freund HJ. Long-term effects of deep brain stimulation in Parkinson’s disease. Brain. 2005;128:2222–3. doi: 10.1093/brain/awh634. [DOI] [PubMed] [Google Scholar]
- Funkiewiez A, Ardouin C, Caputo E, Krack P, Fraix V, Klinger H, et al. Long term effects of bilateral subthalamic nucleus stimulation on cognitive function, mood, and behaviour in Parkinson’s disease. J Neurol Neurosurg Psychiatry. 2004;75:834–9. doi: 10.1136/jnnp.2002.009803. [DOI] [PMC free article] [PubMed] [Google Scholar]
- Galganski ME, Fuglevand AJ, Enoka RM. Reduced control of motor output in a human hand muscle of elderly subjects during submaximal contractions. J Neurophysiol. 1993;69:2108–15. doi: 10.1152/jn.1993.69.6.2108. [DOI] [PubMed] [Google Scholar]
- Guo Y, Rubin JE, McIntyre CC, Vitek JL, Terman D. Thalamocortical relay fidelity varies across subthalamic nucleus deep brain stimulation protocols in a data-driven computational model. J Neurophysiol. 2008;99:1477–92. doi: 10.1152/jn.01080.2007. [DOI] [PubMed] [Google Scholar]
- Hashimoto T, Elder CM, Okun MS, Patrick SK, Vitek JL. Stimulation of the subthalamic nucleus changes the firing pattern of pallidal neurons. J Neurosci. 2003;23:1916–23. doi: 10.1523/JNEUROSCI.23-05-01916.2003. [DOI] [PMC free article] [PubMed] [Google Scholar]
- Hershey T, Revilla FJ, Wernle A, Gibson PS, Dowling JL, Perlmutter JS. Stimulation of STN impairs aspects of cognitive control in PD. Neurology. 2004;62:1110–4. doi: 10.1212/01.wnl.0000118202.19098.10. [DOI] [PubMed] [Google Scholar]
- Hunka K, Suchowersky O, Wood S, Derwent L, Kiss ZH. Nursing time to program and assess deep brain stimulators in movement disorder patients. J Neurosci Nurs. 2005;37:204–10. doi: 10.1097/01376517-200508000-00006. [DOI] [PubMed] [Google Scholar]
- Karimi M, Golchin N, Tabbal SD, Hershey T, Videen TO, Wu J, et al. Subthalamic nucleus stimulation-induced regional blood flow responses correlate with improvement of motor signs in Parkinson disease. Brain. 2008;131:2710–9. doi: 10.1093/brain/awn179. [DOI] [PMC free article] [PubMed] [Google Scholar]
- Kriz G, Hermsdorfer J, Marquardt C, Mai N. Feedback-based training of grip force control in patients with brain damage. Arch Phys Med Rehabil. 1995;76:653–9. doi: 10.1016/s0003-9993(95)80635-0. [DOI] [PubMed] [Google Scholar]
- Kumar R, Lozano AM, Sime E, Lang AE. Long-term follow-up of thalamic deep brain stimulation for essential and parkinsonian tremor. Neurology. 2003;61:1601–4. doi: 10.1212/01.wnl.0000096012.07360.1c. [DOI] [PubMed] [Google Scholar]
- Kurillo G, Zupan A, Bajd T. Force tracking system for the assessment of grip force control in patients with neuromuscular diseases. Clin Biomech (Bristol, Avon) 2004;19:1014–21. doi: 10.1016/j.clinbiomech.2004.07.003. [DOI] [PubMed] [Google Scholar]
- Lindenberger U, Marsiske M, Baltes PB. Memorizing while walking: increase in dual-task costs from young adulthood to old age. Psychol Aging. 2000;15:417–36. doi: 10.1037//0882-7974.15.3.417. [DOI] [PubMed] [Google Scholar]
- Llinas RR, Ribary U, Jeanmonod D, Kronberg E, Mitra P. Thalamocortical dysrhythmia: a neurological and neuropsychiatric syndrome characterized by magnetoencephalography. Proc Natl Acad Sci USA. 1999;96:15222–7. doi: 10.1073/pnas.96.26.15222. [DOI] [PMC free article] [PubMed] [Google Scholar]
- Lujan JL, Noecker AM, Butson CR, Cooper SE, Walter BL, Vitek JL, et al. Automated 3-dimensional brain atlas fitting to microelectrode recordings from deep brain stimulation surgeries. Stereotact Funct Neurosurg. 2009;87:229–40. doi: 10.1159/000225976. [DOI] [PMC free article] [PubMed] [Google Scholar]
- Machado A, Rezai AR, Kopell BH, Gross RE, Sharan AD, Benabid AL. Deep brain stimulation for Parkinson’s disease: surgical technique and perioperative management. Mov Disord. 2006;21(Suppl 14):S247–58. doi: 10.1002/mds.20959. [DOI] [PubMed] [Google Scholar]
- Maks CB, Butson CR, Walter BL, Vitek JL, McIntyre CC. Deep brain stimulation activation volumes and their association with neurophysiological mapping and therapeutic outcomes. J Neurol Neurosurg Psychiatry. 2009;80:659–66. doi: 10.1136/jnnp.2007.126219. [DOI] [PMC free article] [PubMed] [Google Scholar]
- Miocinovic S, Lempka SF, Russo GS, Maks CB, Butson CR, Sakaie KE, et al. Experimental and theoretical characterization of the voltage distribution generated by deep brain stimulation. Exp Neurol. 2009;216:166–76. doi: 10.1016/j.expneurol.2008.11.024. [DOI] [PMC free article] [PubMed] [Google Scholar]
- Miocinovic S, Noecker AM, Maks CB, Butson CR, McIntyre CC. Cicerone: stereotactic neurophysiological recording and deep brain stimulation electrode placement software system. Acta Neurochir Suppl. 2007;97:561–7. doi: 10.1007/978-3-211-33081-4_65. [DOI] [PubMed] [Google Scholar]
- Miocinovic S, Parent M, Butson CR, Hahn PJ, Russo GS, Vitek JL, et al. Computational analysis of subthalamic nucleus and lenticular fasciculus activation during therapeutic deep brain stimulation. J Neurophysiol. 2006;96:1569–80. doi: 10.1152/jn.00305.2006. [DOI] [PubMed] [Google Scholar]
- Moro E, Esselink RJ, Xie J, Hommel M, Benabid AL, Pollak P. The impact on Parkinson’s disease of electrical parameter settings in STN stimulation. Neurology. 2002;59:706–13. doi: 10.1212/wnl.59.5.706. [DOI] [PubMed] [Google Scholar]
- Moro E, Poon YY, Lozano AM, Saint-Cyr JA, Lang AE. Subthalamic nucleus stimulation: improvements in outcome with reprogramming. Arch Neurol. 2006;63:1266–72. doi: 10.1001/archneur.63.9.1266. [DOI] [PubMed] [Google Scholar]
- Oldfield RC. The assessment and analysis of handedness: the Edinburgh inventory. Neuropsychologia. 1971;9:97–113. doi: 10.1016/0028-3932(71)90067-4. [DOI] [PubMed] [Google Scholar]
- Owen AM, McMillan KM, Laird AR, Bullmore E. N-back working memory paradigm: a meta-analysis of normative functional neuroimaging studies. Hum Brain Mapp. 2005;25:46–59. doi: 10.1002/hbm.20131. [DOI] [PMC free article] [PubMed] [Google Scholar]
- Phillips MD, Baker KB, Lowe MJ, Tkach JA, Cooper SE, Kopell BH, et al. Parkinson disease: pattern of functional MR imaging activation during deep brain stimulation of subthalamic nucleus—initial experience. Radiology. 2006;239:209–16. doi: 10.1148/radiol.2391041990. [DOI] [PubMed] [Google Scholar]
- Rizzone M, Lanotte M, Bergamasco B, Tavella A, Torre E, Faccani G, et al. Deep brain stimulation of the subthalamic nucleus in Parkinson’s disease: effects of variation in stimulation parameters. J Neurol Neurosurg Psychiatry. 2001;71:215–9. doi: 10.1136/jnnp.71.2.215. [DOI] [PMC free article] [PubMed] [Google Scholar]
- Rodriguez-Oroz MC, Obeso JA, Lang AE, Houeto JL, Pollak P, Rehncrona S, et al. Bilateral deep brain stimulation in Parkinson’s disease: a multicentre study with 4 years follow-up. Brain. 2005;128:2240–9. doi: 10.1093/brain/awh571. [DOI] [PubMed] [Google Scholar]
- Sahin M, Tie Y. Non-rectangular waveforms for neural stimulation with practical electrodes. J Neural Eng. 2007;4:227–33. doi: 10.1088/1741-2560/4/3/008. [DOI] [PMC free article] [PubMed] [Google Scholar]
- Saint-Cyr JA, Trepanier LL, Kumar R, Lozano AM, Lang AE. Neuropsychological consequences of chronic bilateral stimulation of the subthalamic nucleus in Parkinson’s disease. Brain. 2000;123 (Pt 10):2091–108. doi: 10.1093/brain/123.10.2091. [DOI] [PubMed] [Google Scholar]
- Schupbach M, Agid Y. Psychosocial adjustment after deep brain stimulation in Parkinson’s disease. Nat Clin Practice. 2008;4:58–9. doi: 10.1038/ncpneuro0714. [DOI] [PubMed] [Google Scholar]
- Schupbach WM, Chastan N, Welter ML, Houeto JL, Mesnage V, Bonnet AM, et al. Stimulation of the subthalamic nucleus in Parkinson’s disease: a 5 year follow up. J Neurol Neurosurg Psychiatry. 2005;76:1640–4. doi: 10.1136/jnnp.2005.063206. [DOI] [PMC free article] [PubMed] [Google Scholar]
- Schupbach M, Gargiulo M, Welter ML, Mallet L, Behar C, Houeto JL, et al. Neurosurgery in Parkinson disease: a distressed mind in a repaired body? Neurology. 2006;66:1811–6. doi: 10.1212/01.wnl.0000234880.51322.16. [DOI] [PubMed] [Google Scholar]
- Temel Y, Kessels A, Tan S, Topdag A, Boon P, Visser-Vandewalle V. Behavioural changes after bilateral subthalamic stimulation in advanced Parkinson disease: a systematic review. Parkinsonism Relat Disord. 2006;12:265–72. doi: 10.1016/j.parkreldis.2006.01.004. [DOI] [PubMed] [Google Scholar]
- Temperli P, Ghika J, Villemure JG, Burkhard PR, Bogousslavsky J, Vingerhoets FJ. How do parkinsonian signs return after discontinuation of subthalamic DBS? Neurology. 2003;60:78–81. doi: 10.1212/wnl.60.1.78. [DOI] [PubMed] [Google Scholar]
- The Deep Brain Stimulation Study Group. Deep-brain stimulation of the subthalamic nucleus or the pars interna of the globus pallidus in Parkinson’s disease. N Engl J Med. 2001;345:956–63. doi: 10.1056/NEJMoa000827. [DOI] [PubMed] [Google Scholar]
- Timmermann L, Gross J, Dirks M, Volkmann J, Freund HJ, Schnitzler A. The cerebral oscillatory network of parkinsonian resting tremor. Brain. 2003;126:199–212. doi: 10.1093/brain/awg022. [DOI] [PubMed] [Google Scholar]
- Viola P, Wells WM. Alignment by maximization of mutual information. Int J Comput Vision. 1997;24:137–54. [Google Scholar]
- Vitek JL, Giroux M. Physiology of hypokinetic and hyperkinetic movement disorders: model for dyskinesia. Ann Neurol. 2000;47:S131–40. [PubMed] [Google Scholar]
- Voelcker-Rehage C, Alberts JL. Age-related difference in working memory and force control under dual-task conditions. Aging Neuropsychol Cognit. 2006;13:1–19. doi: 10.1080/138255890969339. [DOI] [PubMed] [Google Scholar]
- Voelcker-Rehage C, Alberts JL. Effect of motor practice on dual-task performance in older adults. J Gerontol B Psychol Sci Soc Sci. 2007;62:P141–8. doi: 10.1093/geronb/62.3.p141. [DOI] [PubMed] [Google Scholar]
- Voelcker-Rehage C, Stronge AJ, Alberts JL. Age-related differences in working memory and force control under dual-task conditions. Neuropsychol Dev Cogn B Aging Neuropsychol Cogn. 2006;13:366–84. doi: 10.1080/138255890969339. [DOI] [PubMed] [Google Scholar]
- Volkmann J, Moro E, Pahwa R. Basic algorithms for the programming of deep brain stimulation in Parkinson’s disease. Mov Disord. 2006;21(Suppl 14):S284–9. doi: 10.1002/mds.20961. [DOI] [PubMed] [Google Scholar]
- Weaver FM, Follett K, Stern M, Hur K, Harris C, Marks WJ, Jr, et al. Bilateral deep brain stimulation vs best medical therapy for patients with advanced Parkinson disease: a randomized controlled trial. JAMA. 2009;301:63–73. doi: 10.1001/jama.2008.929. [DOI] [PMC free article] [PubMed] [Google Scholar]
- Woods SP, Fields JA, Troster AI. Neuropsychological sequelae of subthalamic nucleus deep brain stimulation in Parkinson’s disease: a critical review. Neuropsychol Rev. 2002;12:111–26. doi: 10.1023/a:1016806711705. [DOI] [PubMed] [Google Scholar]