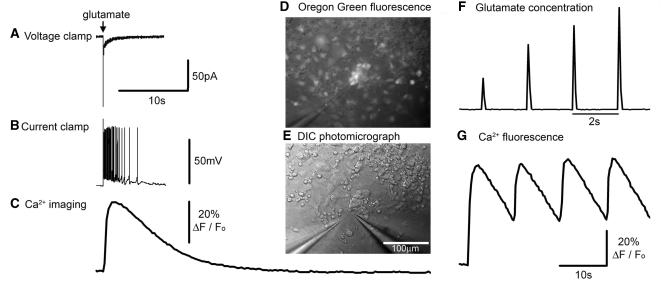
Figure 1.
Neuronal responses to exogenously applied glutamate. (A–C) Different recording modes showing equivalent responses of a neuron to 1 mM glutamate delivered from a distance of about 25 μm from a patch pipette subsequent to a 10 ms pressure pulse applied to the pipette. All three recording modes are shown at the same time scale for ease of comparison. The culture was bulk loaded with OGB1, and the calcium response was recorded first, prior to patching (whole cell patching causes the bulk-loaded dye to be washed out); this cell had a robust and relatively constant (<5% variability) Ca2+ fluorescence response, thus allowing an appropriate correspondence with the subsequently recorded electrophysiology. The voltage clamp response was recorded at −70 mV. The sharp event is likely to be a breakthrough action potential. The current clamp recording was made with a small (8 pA) hyperpolarizing holding current to keep the baseline Em at −70 mV. Note the different decay rates of the current, the membrane potential and the Ca2+ dye fluorescence signal [since this greatly exceeds the decay in other preparations (Trevelyan et al., 2006), this is presumed to reflect the cytosolic concentration]. The responses shown were from a cell with a severe mitochondrial deficit. (D) Photomicrograph showing a cluster of neurons loaded with the Ca2+ dye, OGB1 (epi-fluorescence illumination and with low light transillumination). The pipette (at 7 o’clock) contains 1 mM glutamate in artificial CSF, from which brief pulses of glutamate are delivered on to the cultured neurons. (E) The same field viewed using differential interference microscopy, and also showing a patch pipette (5 o’clock) onto one of the OGB labelled neurons seem in D. (F) Change in fluorescence ∼25 mm in front of the picospritzing pipette when filled with a dilute concentration of rhodamine. This allows a visualization of the time course of the local glutamate concentration in these picospritzing experiments. Pulses were delivered at 2 s intervals for this visualization, although the cell behaviour was studied using lower frequency stimuli. (G) Pulsatile Ca2+ fluorescence in response to a 0.1 Hz train of glutamate applications.

