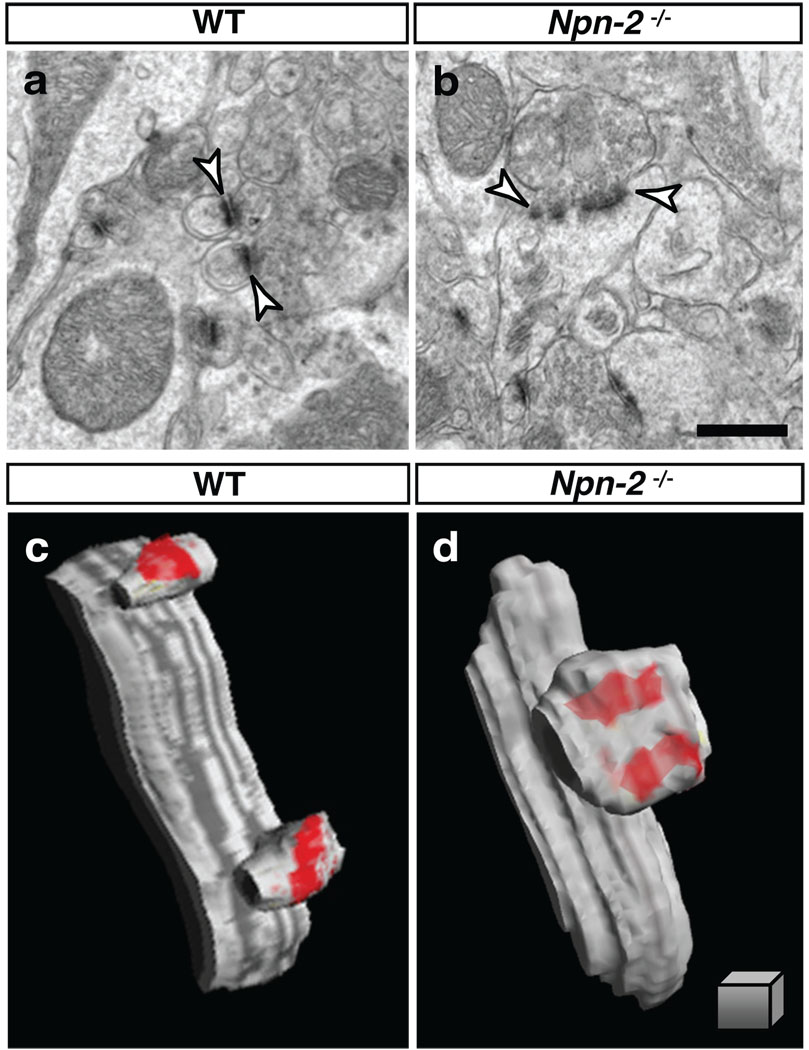
Figure 3. Sema3F-Npn2 signaling regulates spine morphology and synaptic ultrastructure in vivo.
a, b, DG GC dendritic spine TEM ultrastructural analysis reveals enlarged and misshapen spines (arrowheads) in Npn2−/− (b) as compared to WT mice (a). c, d, 3-D reconstructions of serial TEM illustrates two completely separate PSDs within a single spine from a Npn-2−/− mutant mouse (d), in contrast to a WT spine (c) with one PSD per spine head. Scale bars: 500 nm in b for a, b, and 250 nm3 in d for c, d

